
The document is becoming an observable decision surface.
For years, the main question in business document sharing was whether a file could be delivered reliably. In 2026, delivery is table stakes. The more valuable question is what happened after the recipient opened the material.
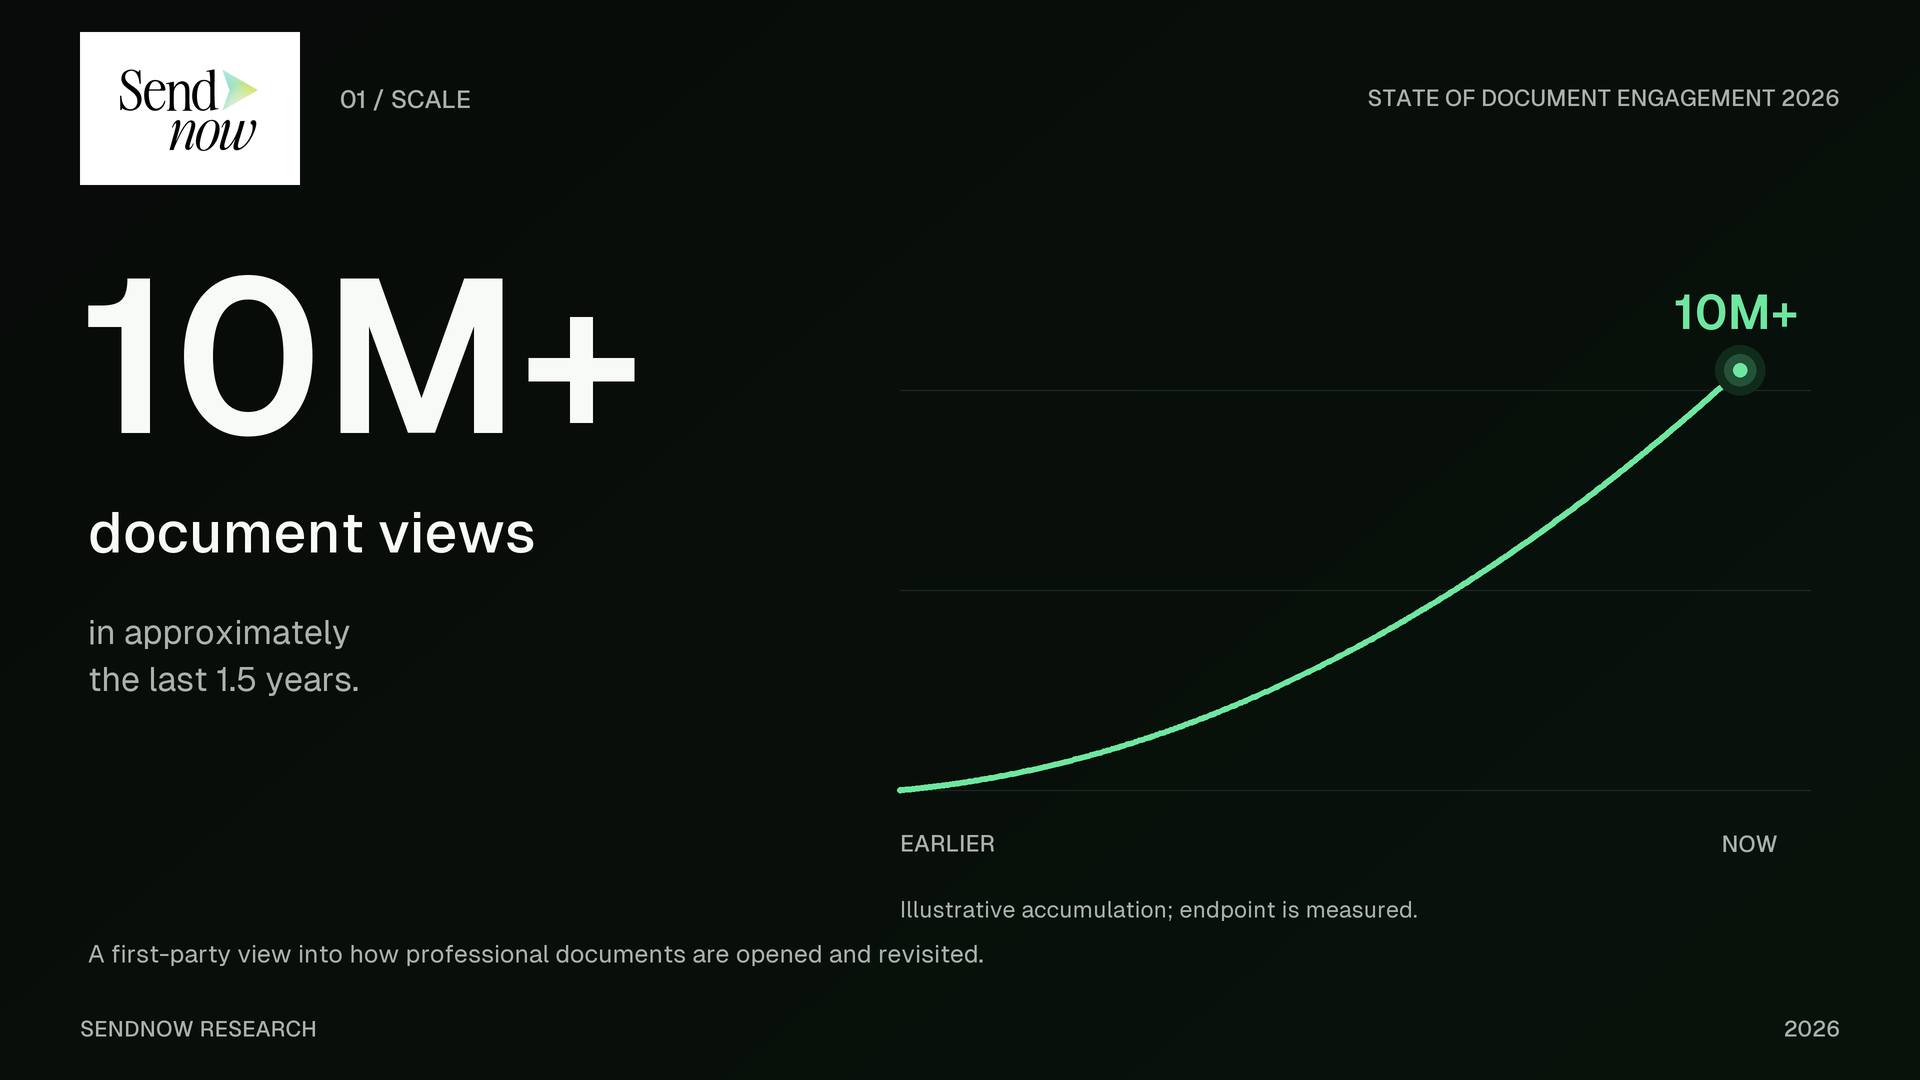
Across SendNow, more than 10 million document views over roughly the last year and a half provide a large first-party window into this behavior. The data does not suggest that recipients patiently read every document from top to bottom. Instead, it suggests a more compressed pattern: short viewing sessions, concise presentation formats, return visits when interest or evaluation continues, and increasing use of access controls around sensitive material.
The average viewing duration across the platform is approximately two minutes and thirty seconds. That number should not be interpreted as “poor performance” by default. A two-minute session on an eight-page pitch deck can represent a complete scan. The same two-minute session on an eighty-page diligence document may represent only an initial triage. Duration becomes useful when it is interpreted alongside document length, page activity, repeat viewing and downstream action.
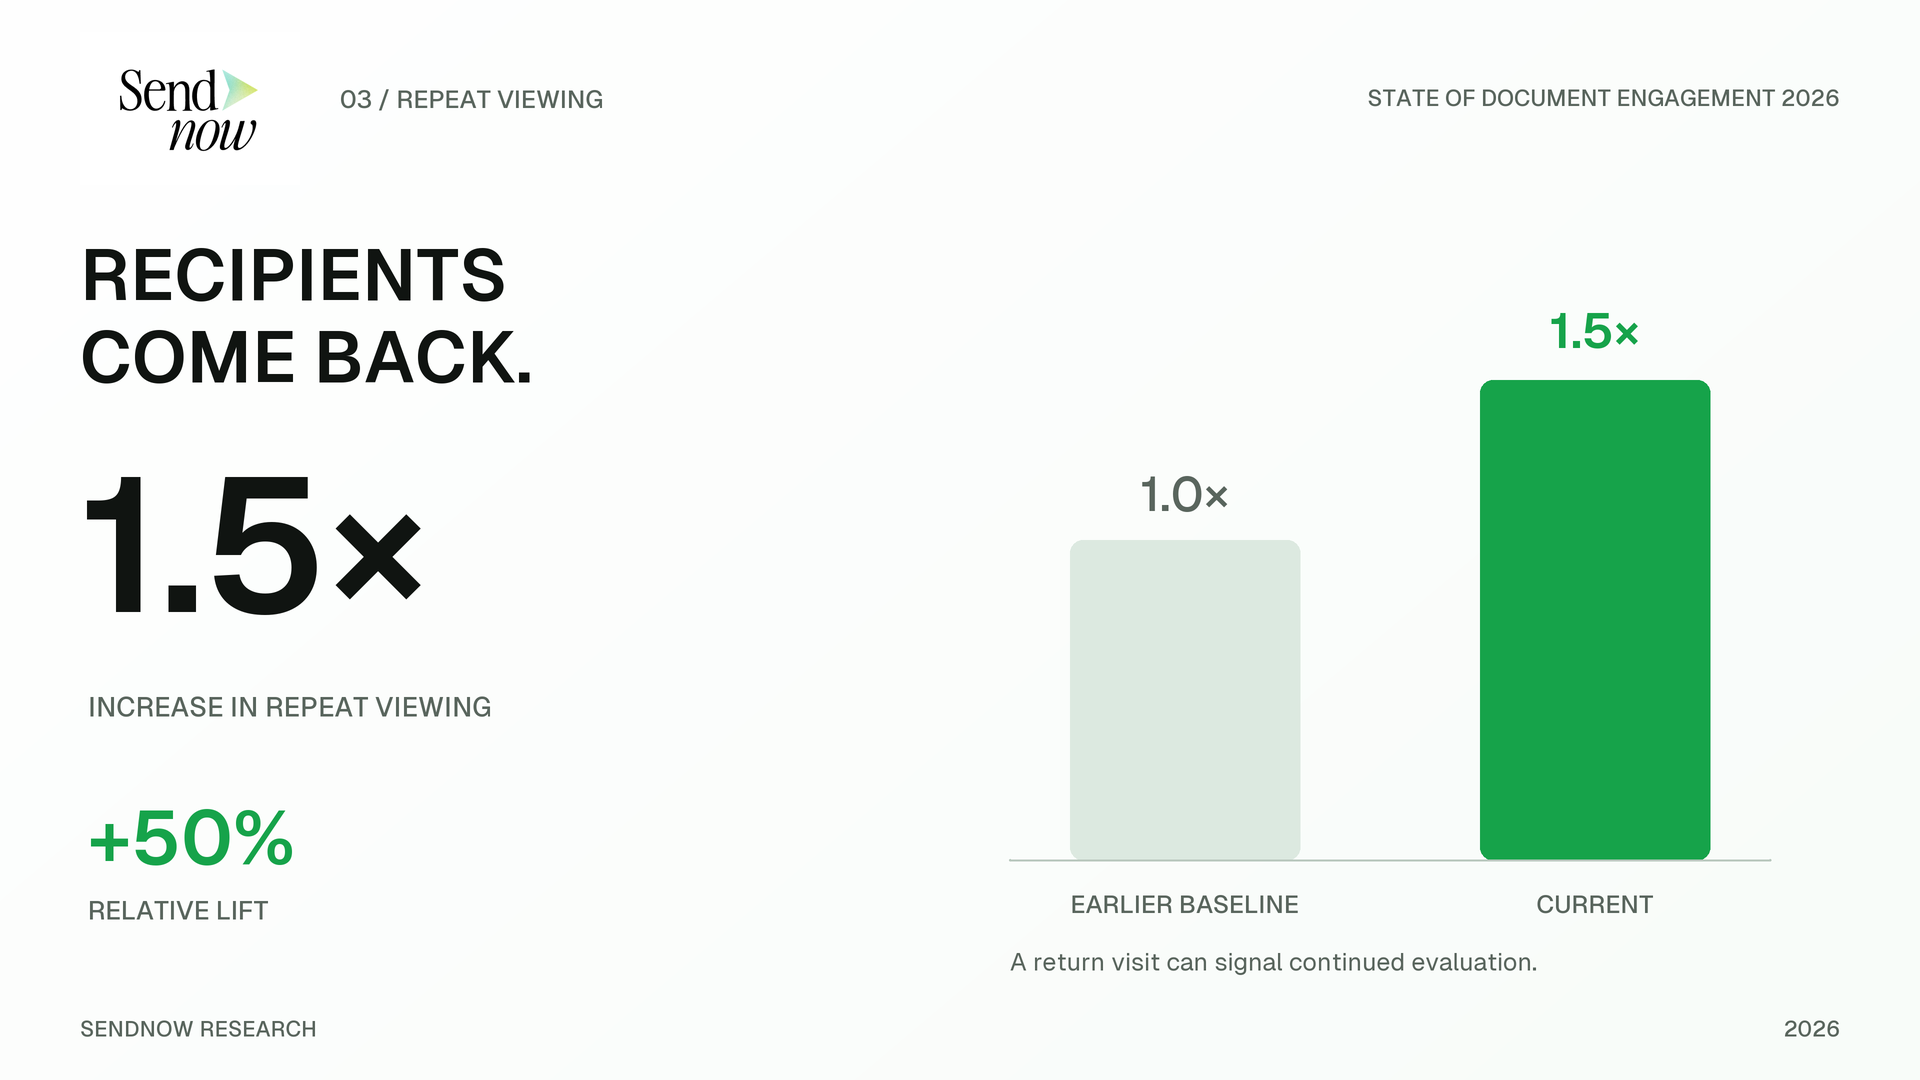
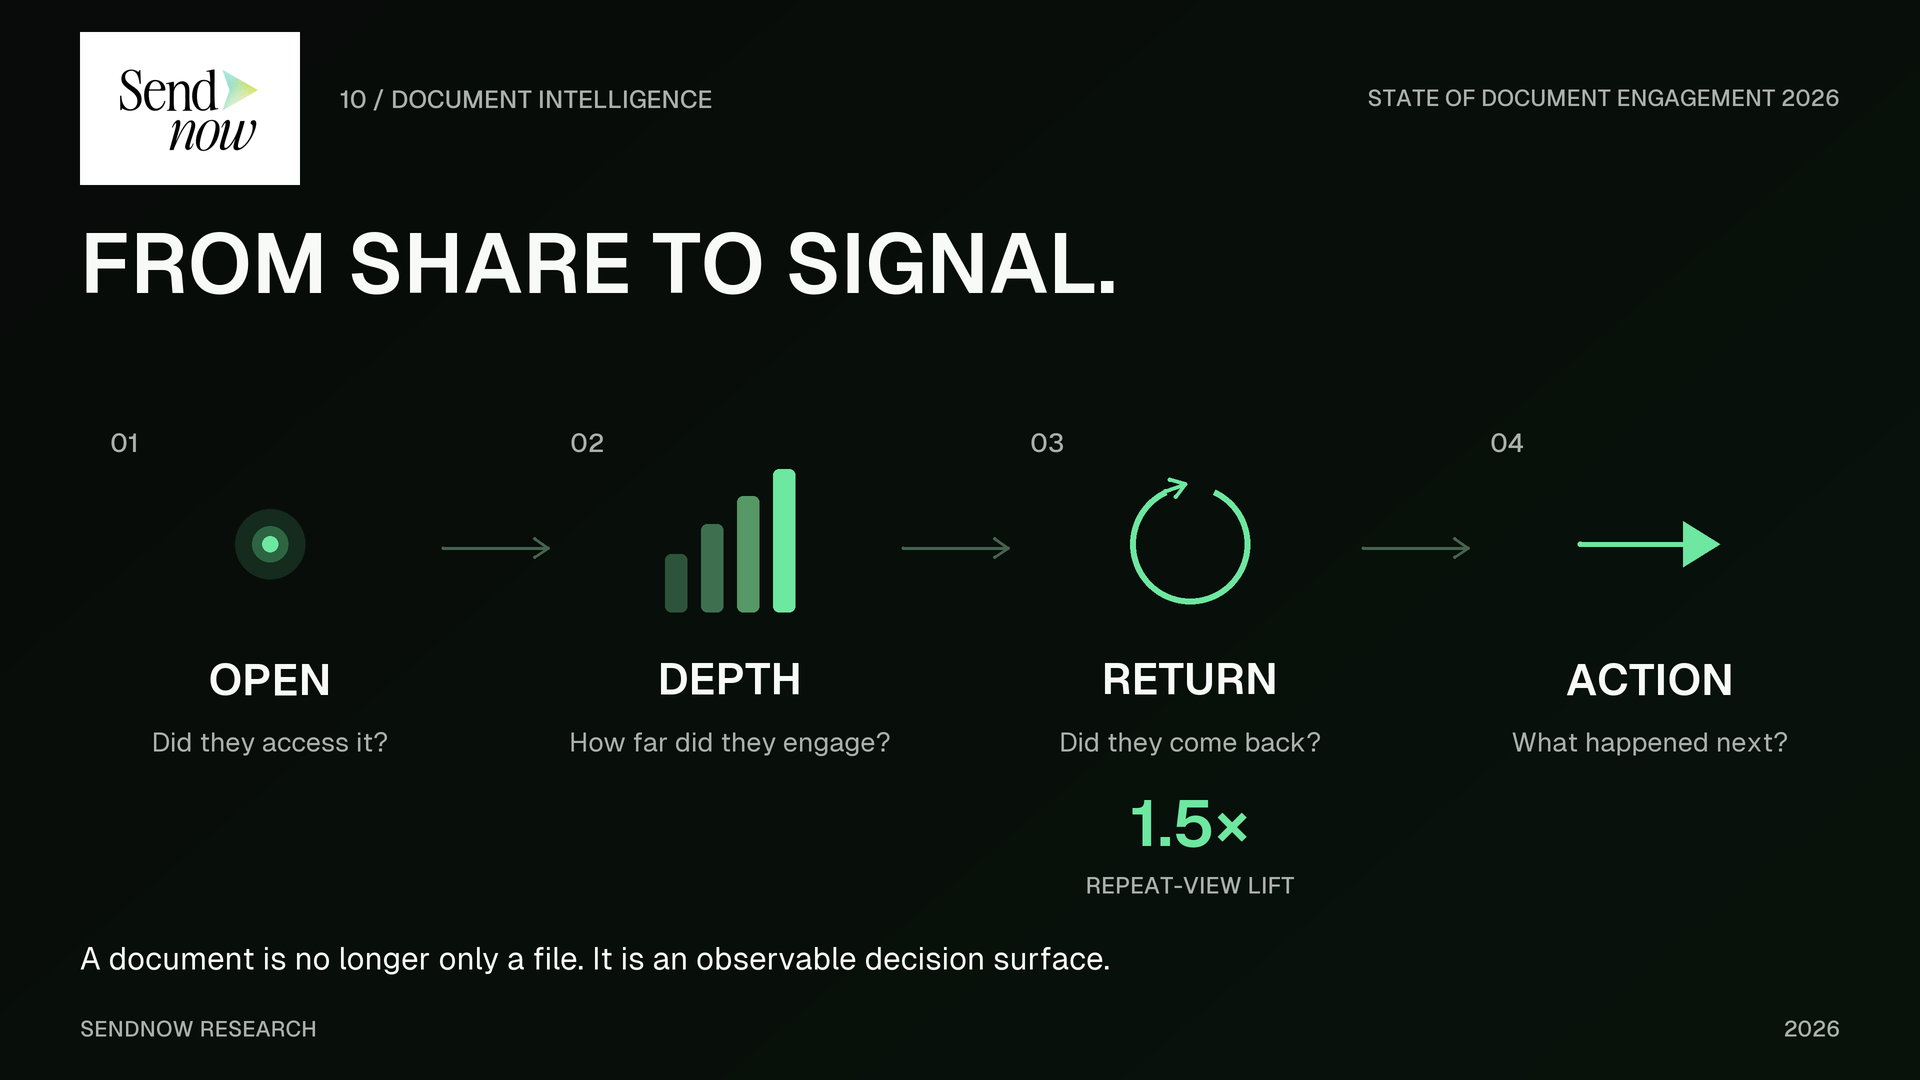
Repeat viewing has increased approximately 1.5×. This is strategically important because the value of document analytics is often highest after the first session. A recipient returning to the same material can indicate that the document is still active in their decision process. It does not prove positive intent, and SendNow does not recommend treating it as a deterministic score. But return behavior can help a founder, salesperson, adviser or deal team decide when a follow-up deserves priority.
Attention is compressed. Decision-critical information needs to appear earlier and be easier to scan.
Repeat views are becoming a more meaningful operational signal than raw open counts alone.
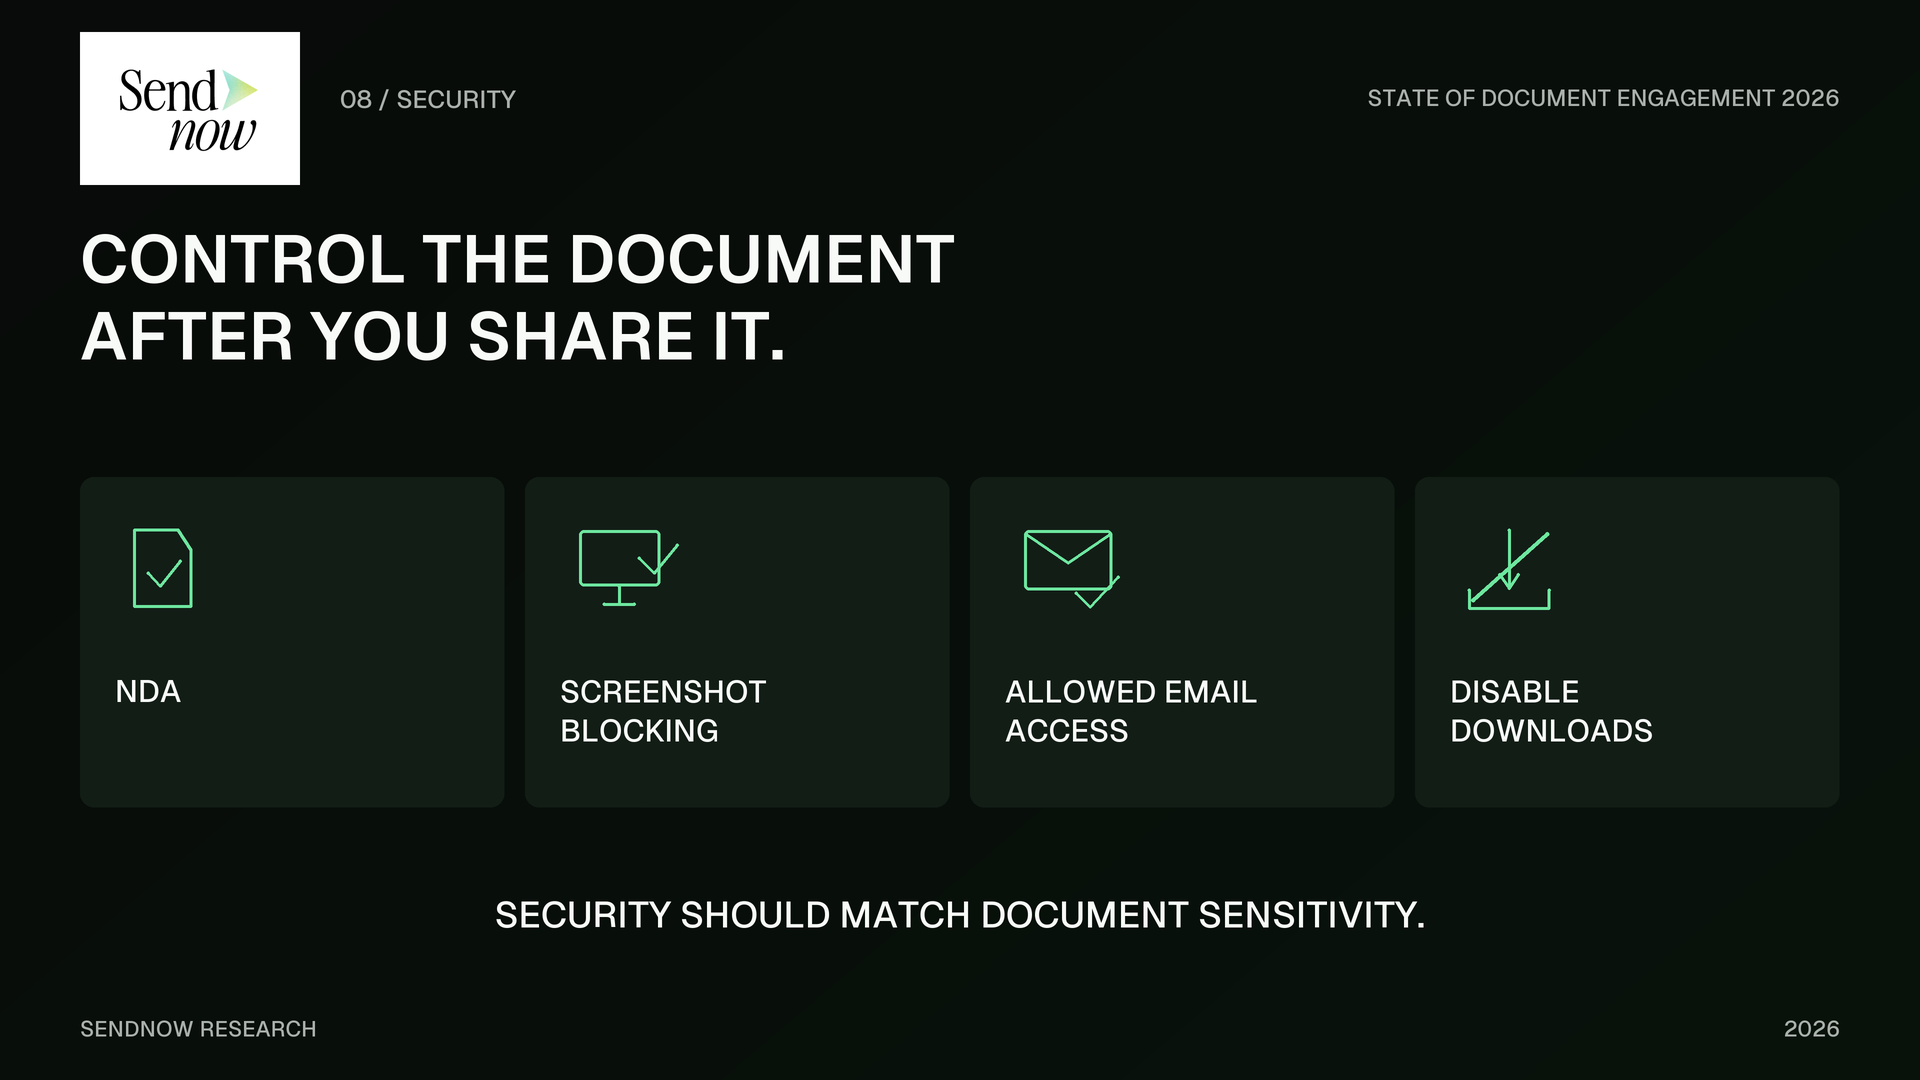
NDA gates, screenshot blocking, allow-listed email access and disabled downloads sit closer to analytics than before.
More numbers, without pretending modeled data is measured data.
This dashboard combines measured SendNow inputs, direct mathematical derivations, and clearly labeled modeling so the report has more quantitative depth without blurring the evidence boundary.
Illustrative score based on attention efficiency, repeat-view lift, analytics usage and security-control availability.
10M+ views turn document engagement into a measurable workflow.
The strongest advantage of first-party research is not a clever opinion. It is the ability to observe behavior that generic industry commentary cannot see.
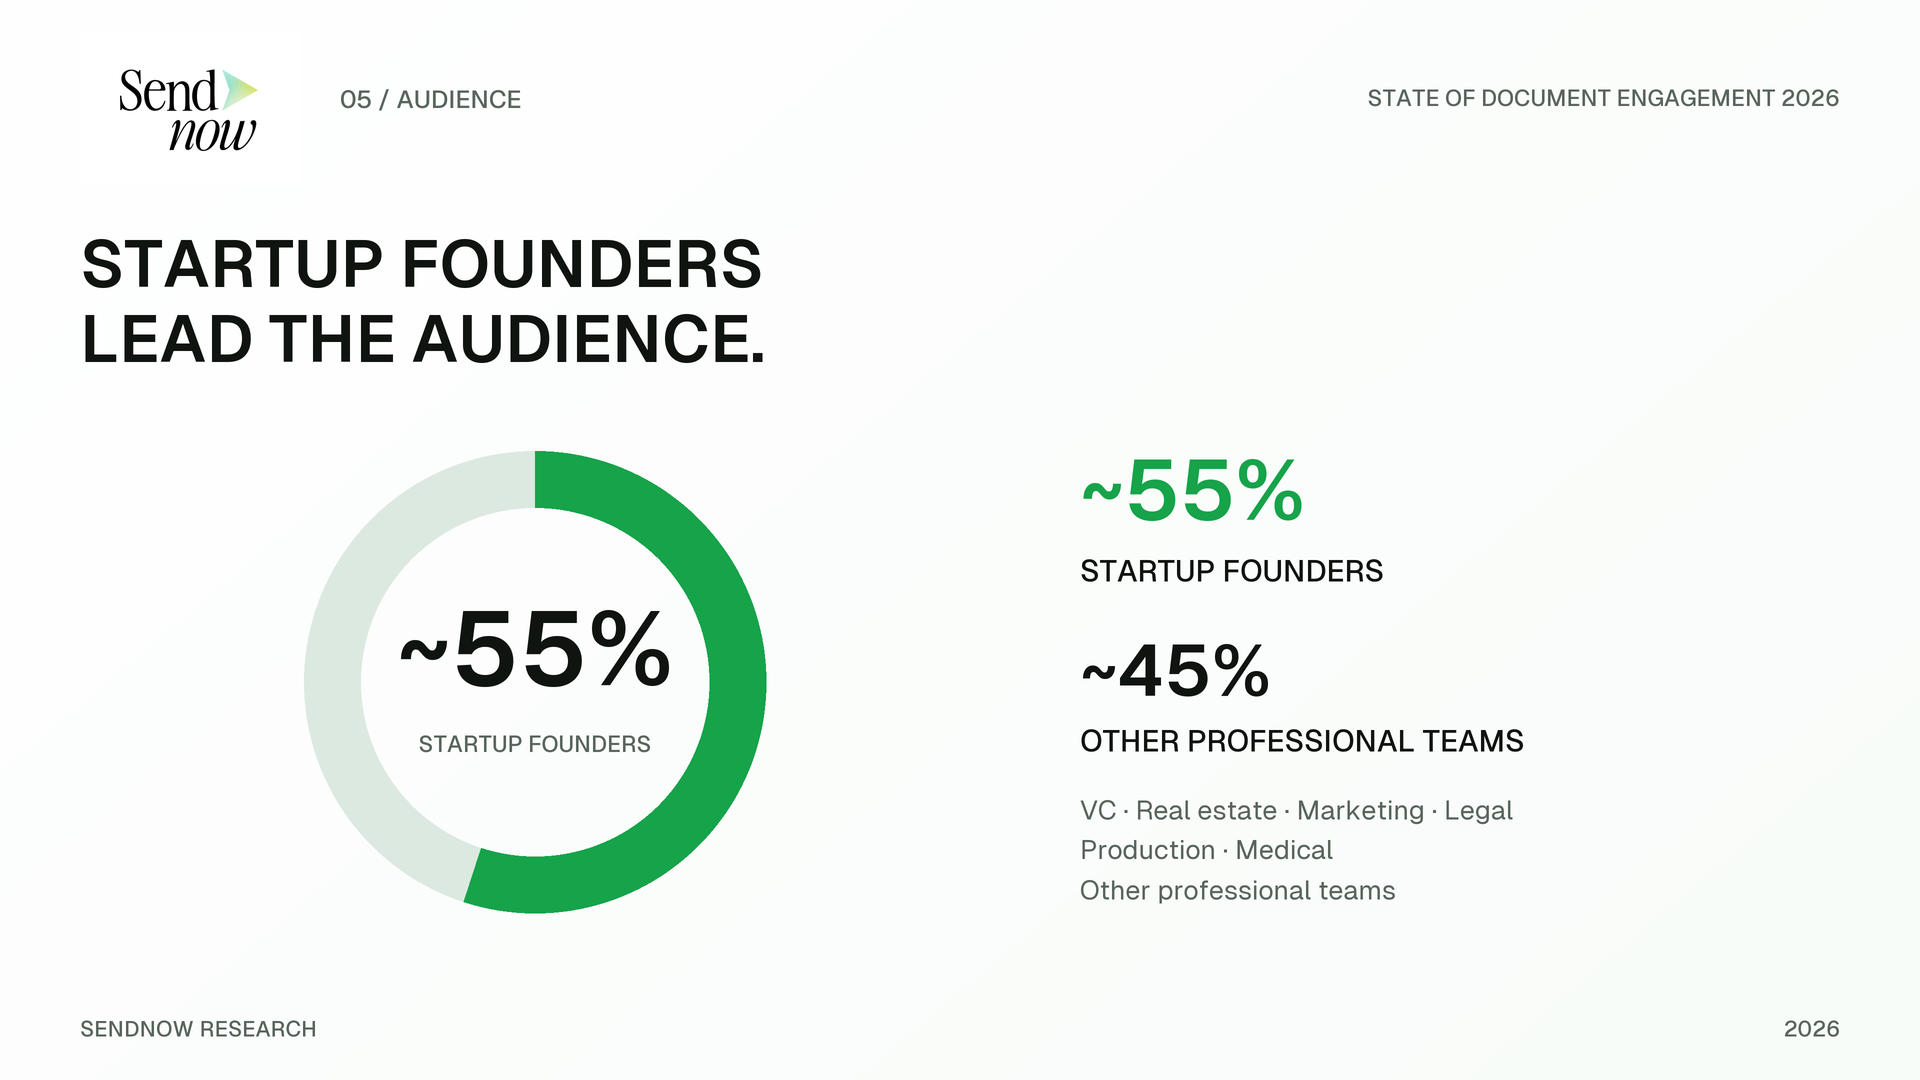
SendNow has accumulated more than 10 million document views over approximately 18 months. Those views come from professional sharing workflows built around presentations, PDFs, Microsites, controlled document links and other recipient-facing experiences. The platform user base now exceeds 10,000 teams, with approximately 55% of the user base made up of startup founders and the remaining audience spanning venture capital, real estate, marketing, legal, production, medical and other professional categories.
That composition matters because document engagement is not limited to one narrow use case. Founders may care about how investors read a pitch deck. Venture teams may care about controlled access to deal material. Real-estate professionals may share property packages and financial documentation. Marketers may send proposals and media kits. Legal teams may prioritize access controls and auditability. Production companies may share treatments, scripts and confidential creative material. Medical organizations may have strict privacy and compliance requirements that must be assessed before any analytics workflow is used.
Average viewing duration is 2 minutes 30 seconds.
The most important implication is not that “people have no attention span.” It is that professional documents compete with inboxes, meetings, chat, mobile notifications and other decision inputs.
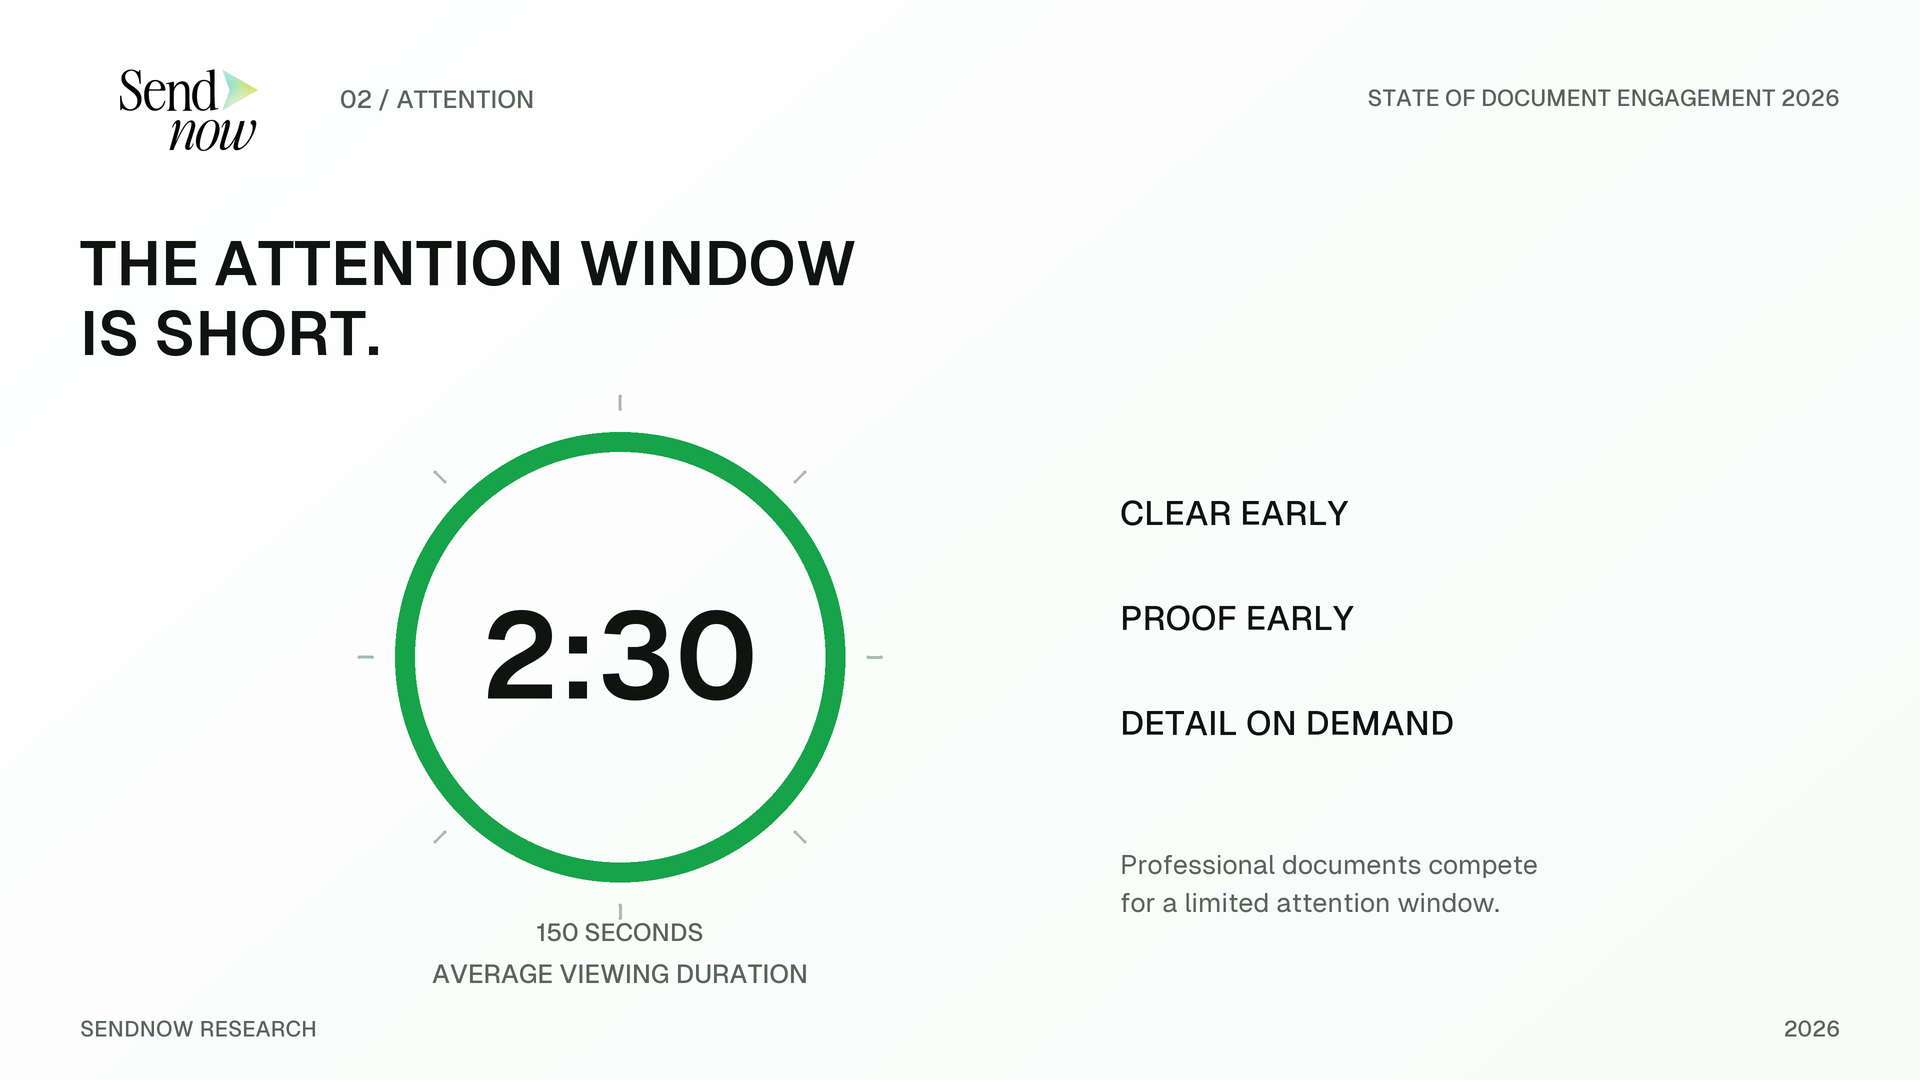
Two minutes and thirty seconds is enough time to understand a concise argument. It is not enough time to absorb unnecessary complexity. For document creators, the practical response should be editorial: put the most important message early, make hierarchy obvious, reduce filler, show proof quickly and let the recipient navigate to depth when needed.
Viewing duration also has to be interpreted carefully. Time is not the same as quality. A viewer may leave a tab open. A viewer may read rapidly. A familiar investor may only revisit two pages they already know they care about. A buyer may open a proposal on mobile, skim it and later return on desktop. The strongest analytics strategy therefore combines duration with depth, repeat visits, page-level behavior and explicit actions.
This is a transparent derived index that combines two platform-level averages. It is useful as an editorial planning heuristic, not as a claim that the average viewer literally spends 18.75 seconds on every pitch-deck page. The viewing-duration and pitch-deck-length metrics may represent different underlying populations.
What should document creators do with a 2:30 window?
First, make page one useful. A recipient should understand the document's purpose immediately. Second, move decision-critical proof earlier. Founders should avoid hiding the core traction or value proposition behind several setup slides. Sales teams should surface the business problem, proposed outcome and key evidence before lower-priority implementation detail. Real-estate packages should make the asset, economics and key diligence context easy to locate. Legal and advisory teams should make navigation obvious so recipients can jump directly to relevant sections.
Third, design for re-entry. Repeat viewing is increasing, so documents should remain legible when a recipient returns days later. Clear section labels, consistent hierarchy and concise page titles make the second session more efficient. A good document is not only easy to read from the beginning; it is easy to reopen at the exact point where the decision is happening.
| Modeled phase | Seconds | Share | Interpretation |
|---|---|---|---|
| Orientation | 27s | 18% | Understand what the deck is and why it matters. |
| Core evaluation | 71s | 47% | Assess product, traction, economics and evidence. |
| Selective depth | 37s | 25% | Spend extra time on pages that matter most. |
| Exit / action | 15s | 10% | Close, forward, revisit later or take another action. |
Repeat views have increased approximately 1.5×.
A first open answers a delivery question. A repeat open starts to answer a process question: is the document still active in the recipient's workflow?
Repeat engagement is one of the most useful examples of why document analytics should not be reduced to vanity metrics. A document with many superficial opens can be less operationally useful than a document with fewer viewers who return, spend time in decision-critical sections and interact with supporting links.
The 1.5× increase in repeat views should be treated as a change index rather than a conversion metric. It tells us that repeat behavior is materially higher than the earlier baseline used by SendNow. It does not tell us that every repeat view is positive, nor that a repeat viewer is 1.5× more likely to buy, invest or sign. The value is prioritization: the sender has more evidence that the document remains relevant enough to revisit.
A 1.5× index is mathematically equivalent to a 50% relative increase from the normalized baseline. This does not reveal the absolute repeat-view rate, which is intentionally not invented here.
Why repeat viewing matters across verticals
For a startup founder, a return to the pitch deck may be a reason to prepare for follow-up, especially if the same recipient revisits financials, product or traction. For sales and marketing, a buyer returning to a proposal may indicate that the material is being compared, circulated or reconsidered. For real estate, repeat access to an investment package can be a useful signal during a transaction. For legal or production workflows, repeat activity may simply reflect ongoing review. Context remains essential.
The average pitch deck is approximately 8 pages.
Eight pages is short enough to force prioritization and long enough to tell a coherent business story. Combined with a 2:30 viewing window, it reinforces a broader preference for compressed information.
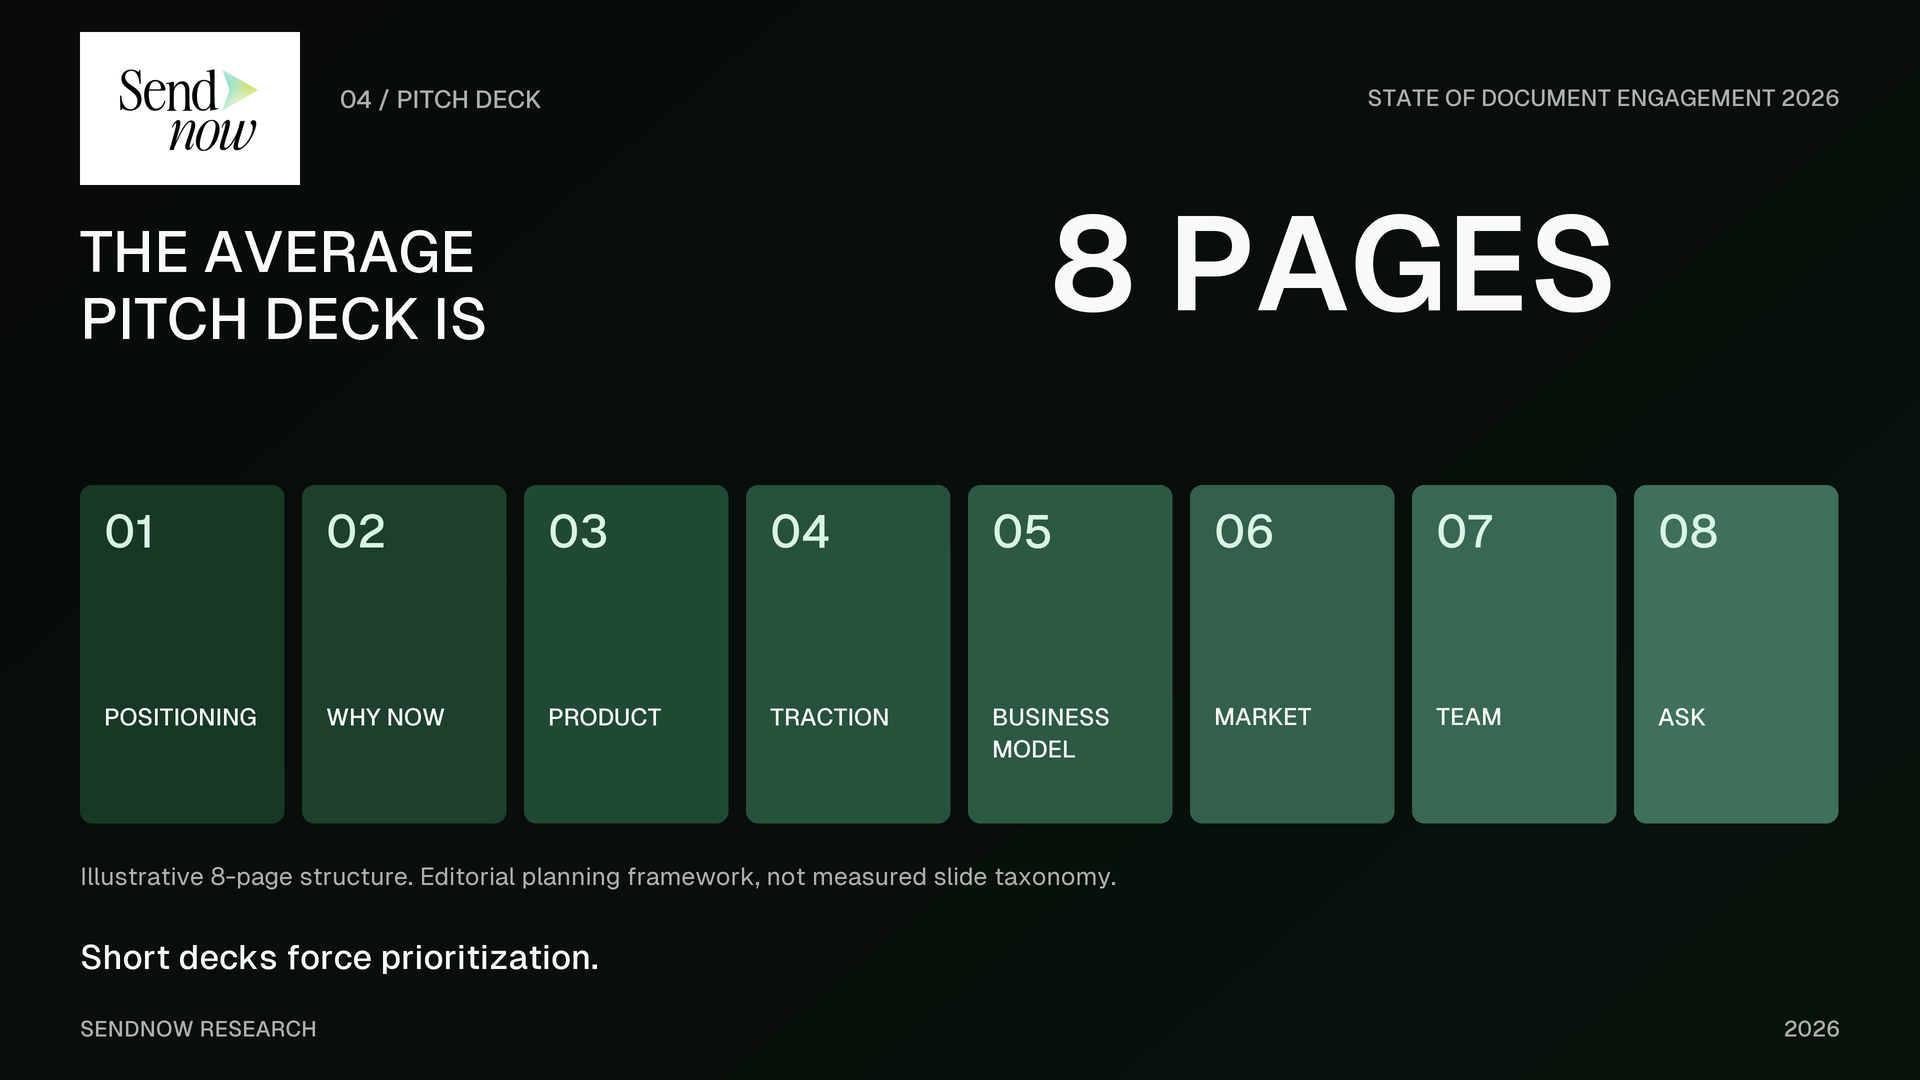
A pitch deck is one of the purest examples of a decision document. The recipient rarely opens it because they want to admire the formatting. They are trying to answer a small set of high-value questions: What does this company do? Why now? Is there evidence of demand? Why this team? What is the opportunity? What would I need to believe before the next conversation?
An eight-page average suggests that many SendNow founders are already operating with relatively concise materials. That creates an opportunity for better page sequencing rather than simply “making the deck shorter.” The goal is not minimalism for its own sake. The goal is to maximize useful information inside the recipient's attention window.
This score is intentionally modeled, not a SendNow measured KPI. It is a planning tool: the more of a short deck that directly answers investor decision questions, the higher the score. Teams can adapt the definition of “decision-critical” to their own audience.
PDF and PPTX remain central to professional sharing.
The format decision is not just technical. It affects fidelity, presentation behavior, media, accessibility, editing expectations and the viewer experience.
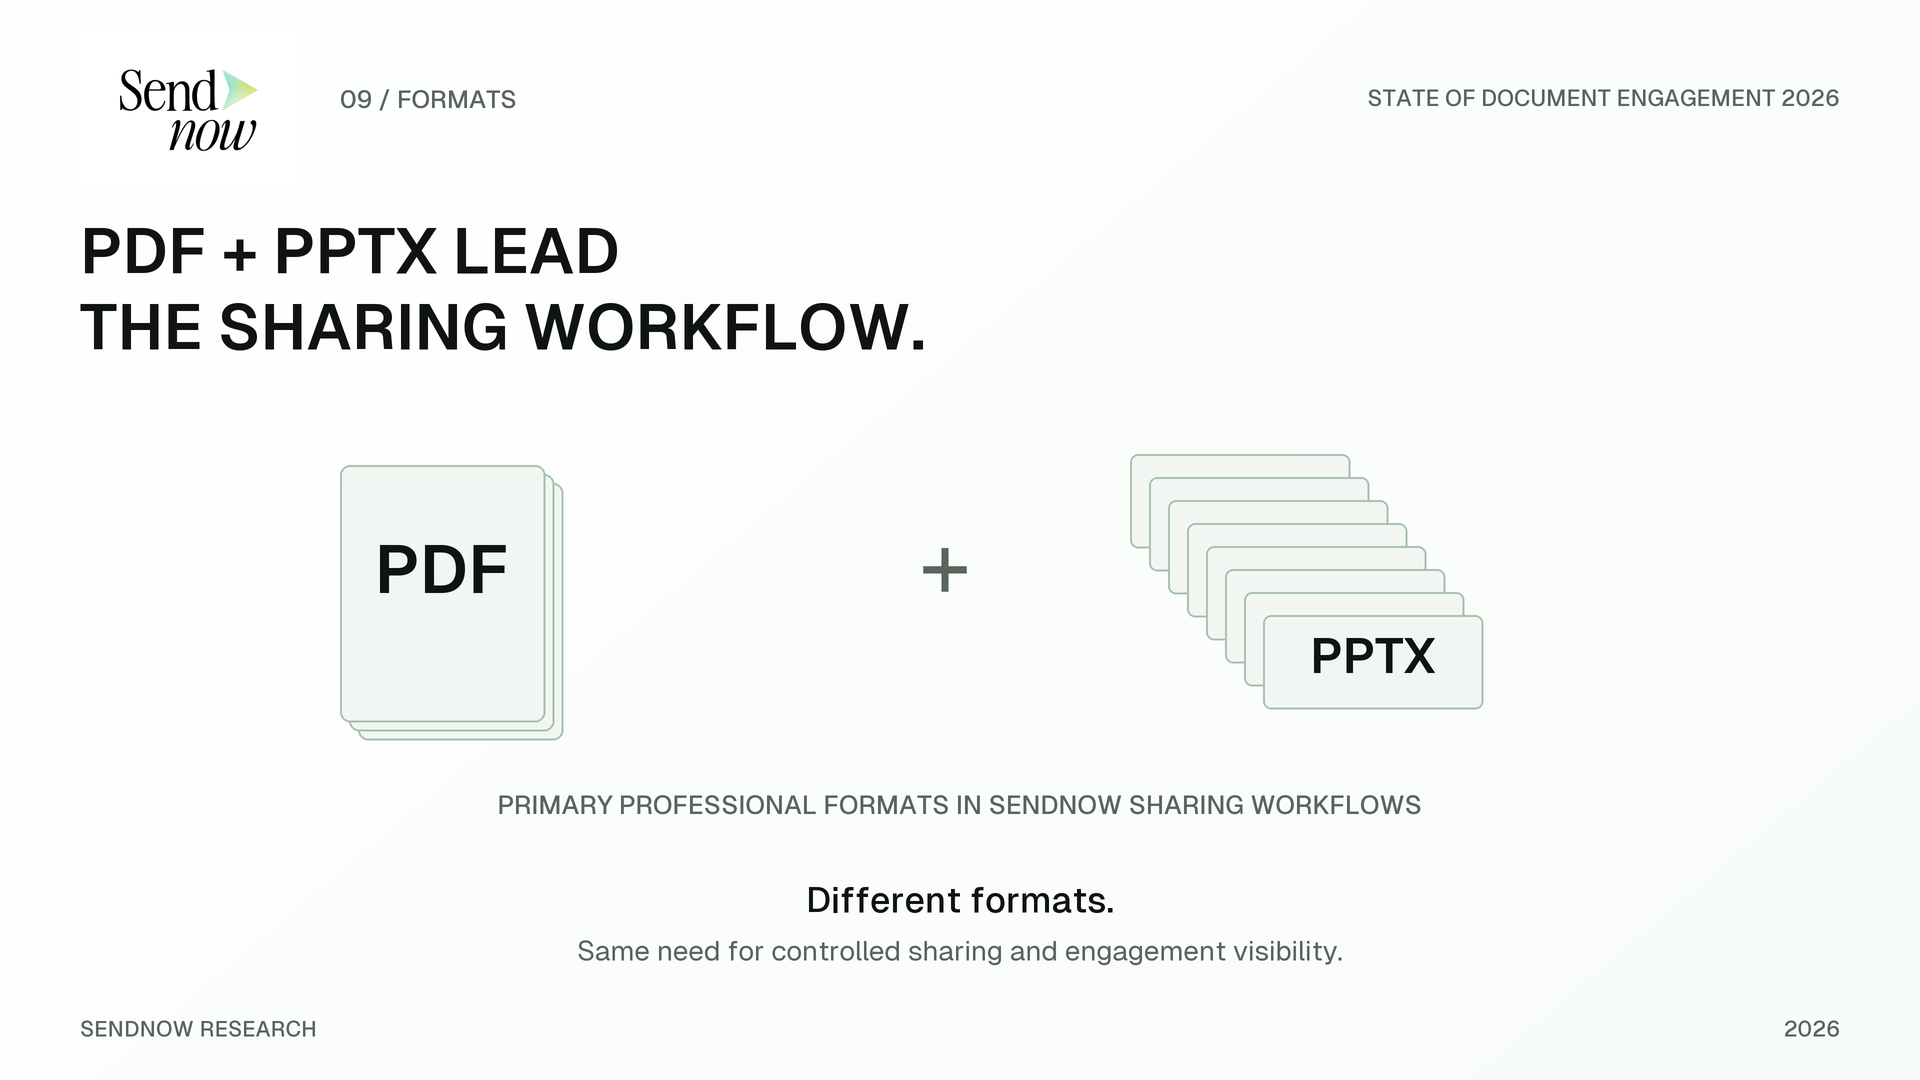
SendNow's first-party profile identifies PDF and PPTX as primary formats in these workflows. PDF remains a natural choice when a sender wants a stable layout that behaves consistently across devices. PPTX is valuable when presentation fidelity, slide structure, embedded media or presentation-origin content matters. The right format depends on the job of the document.
| Use case | PDF tends to fit when… | PPTX tends to fit when… |
|---|---|---|
| Pitch deck | You want a fixed, lightweight representation. | You want native presentation structure or richer slide behavior. |
| Proposal | The proposal behaves like a final document. | The proposal is designed as a presentation and may contain media. |
| Diligence | Records need consistent rendering and easy archival behavior. | Supporting material originated in presentation format. |
| Sales content | You need easy cross-device viewing. | You want slide-level storytelling with richer presentation assets. |
Future SendNow benchmark editions should compare actual engagement by format: completion, time by page, repeat-view frequency, download rate and CTA interaction. That comparison should only be published after the underlying populations and event definitions are validated. This edition intentionally does not invent a PDF-vs-PPTX winner.
The dominant creator workflow is upload → link → analytics.
Six months of PostHog product-usage signals on share.sendnow.live show where creators interact with SendNow. These are approximate shares of distinct PostHog identities, not shares of customers, paid users or all document views.
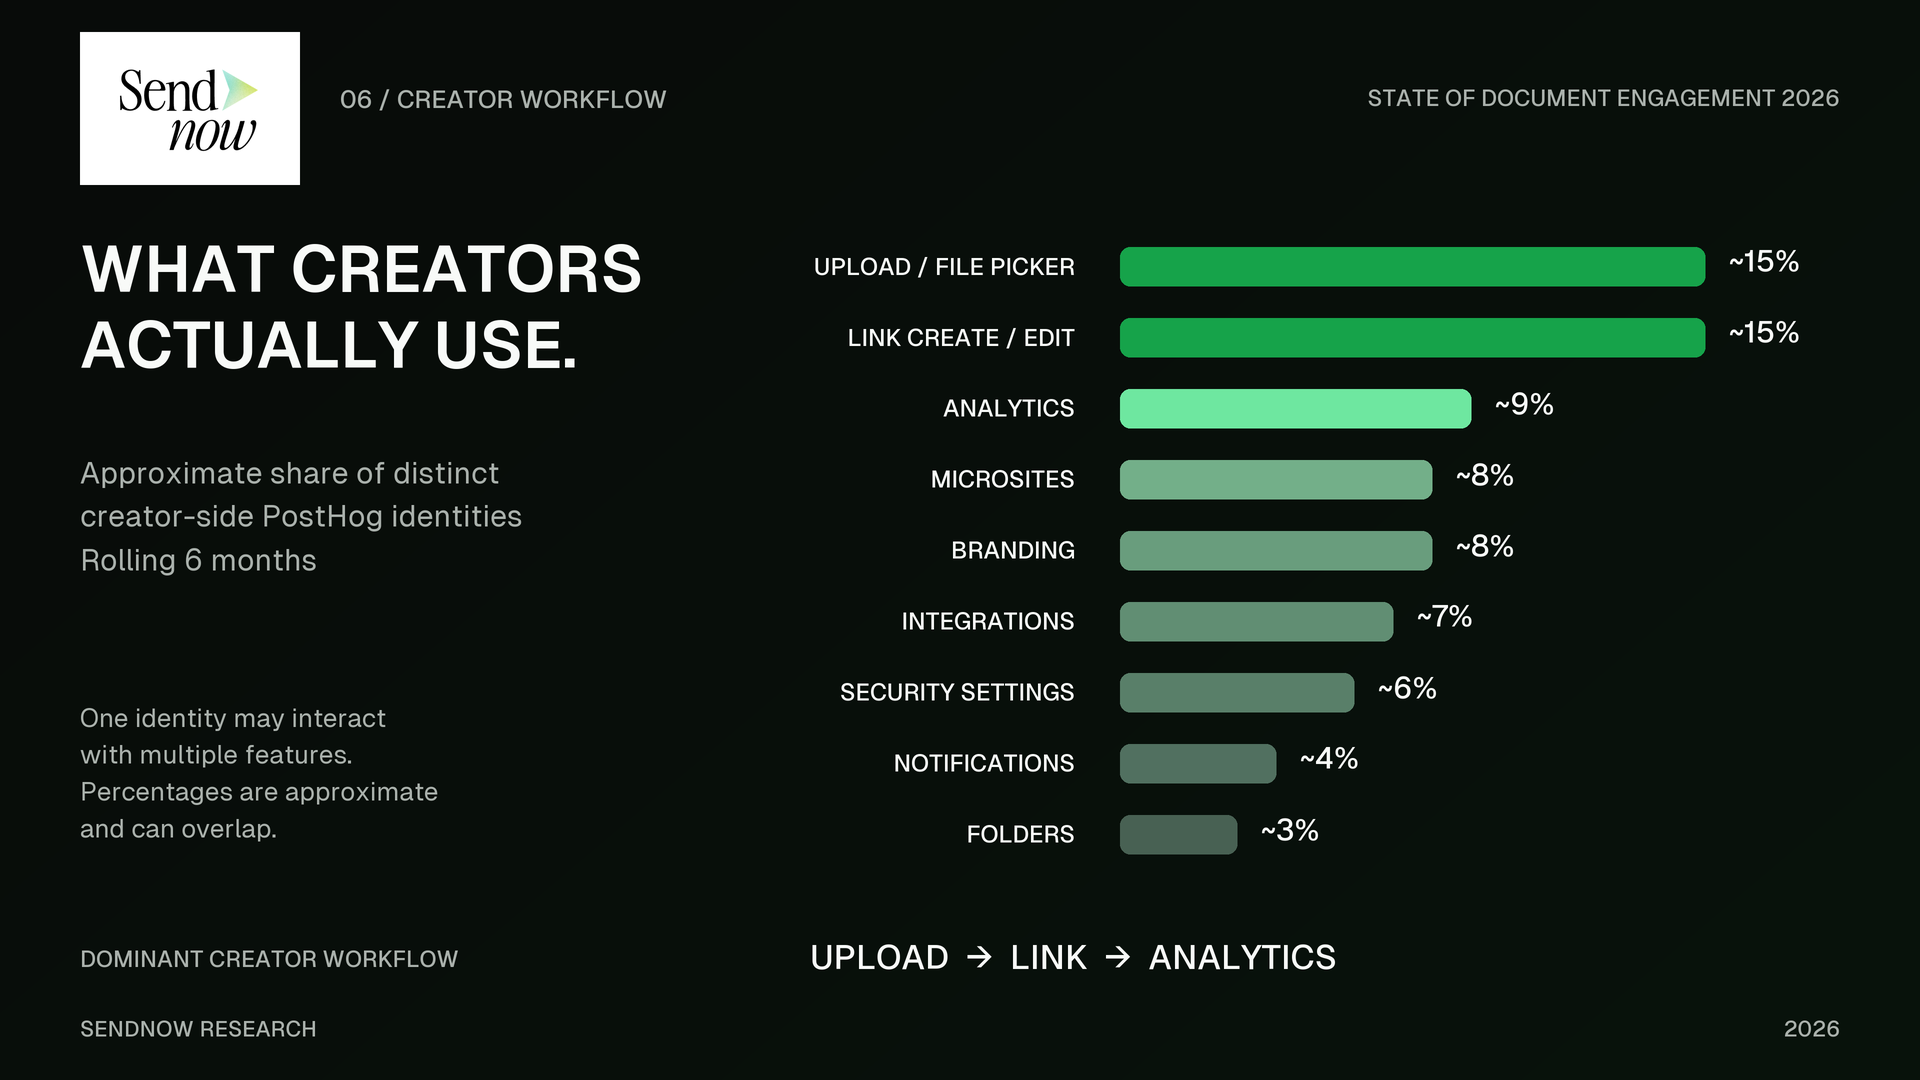
The leading pattern is coherent with the product's central job. Creators pick or upload a file, generate or edit a controlled link, and then return to analytics. Microsites and branding sit one step deeper in the workflow: they become useful when the recipient experience is no longer a single file but a branded destination containing multiple assets or a more deliberate presentation layer.
Integrations, security settings and notifications appear as smaller but meaningful layers. This is expected in a broad user base because not every share needs every control. A public marketing document may need only a trackable link. A fundraising data room may need multiple files, branding and analytics. A sensitive legal share may prioritize allowed-email access, NDA gating, disabled downloads and screenshot controls.
This is a modeled concentration index built from overlapping feature shares. Because a single identity can interact with multiple features, it must not be interpreted as “52% of all product usage.” Its only purpose is to show how strongly the visible creator workflow clusters around upload, link creation and analytics.
Secure sharing is becoming part of the engagement layer.
SendNow supports NDA gates, screenshot blocking, allow-listed email access and disabled downloads, allowing teams to choose controls that match document sensitivity.
Require recipients to accept an agreement before accessing protected content.
Add friction against casual capture in supported environments. It should not be described as absolute prevention.
Restrict access to approved recipient email addresses when identity matters.
Keep the recipient experience view-only when local file distribution is not required.
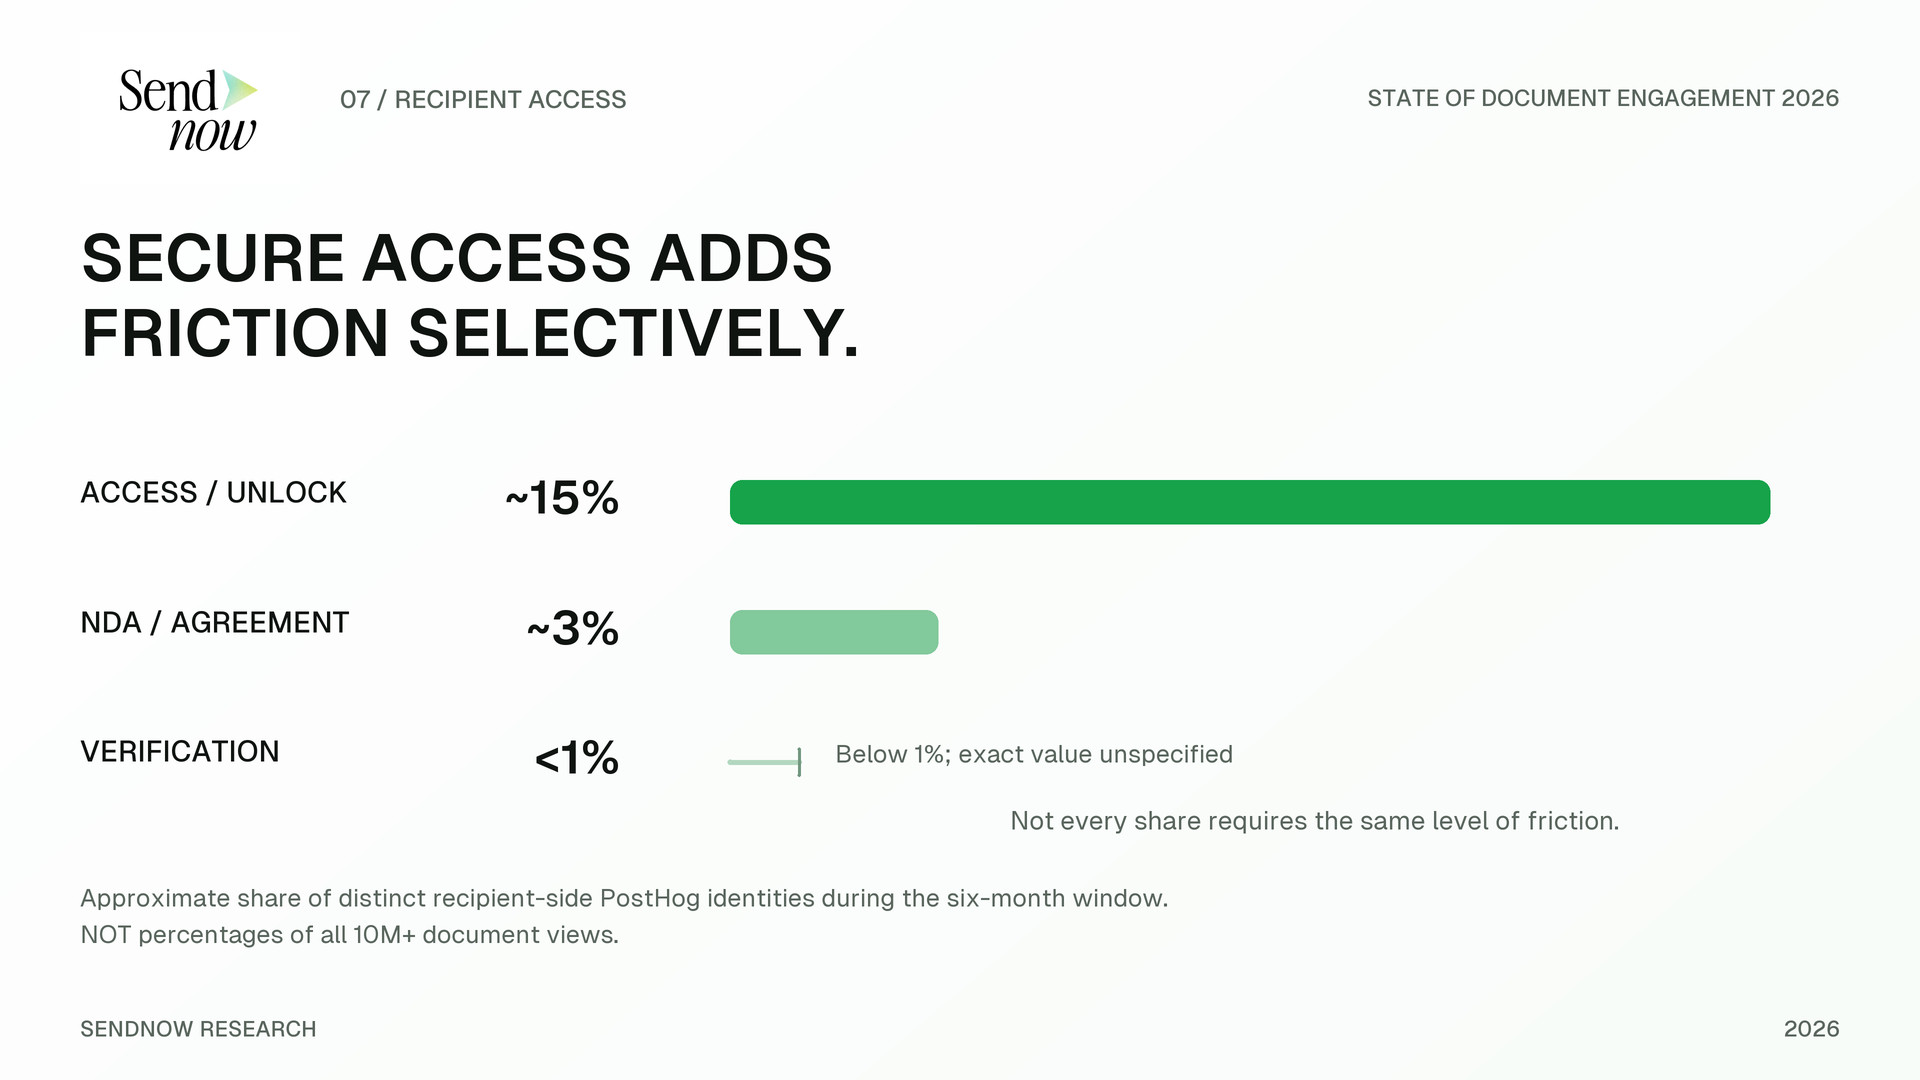
The difference between a 15% access/unlock interaction share and a smaller NDA or verification share illustrates a useful product principle: security controls should be proportional. Not every recipient needs a legal gate. Not every file needs verification. The value of a secure-sharing platform is the ability to apply the right friction to the right document without forcing every workflow into the same maximum-security configuration.
This is a deliberately modeled index, not a measured SendNow KPI. The weights represent increasing recipient friction, and the verification input uses a conservative 1% upper bound because the published signal is “less than 1%.” The index is useful for comparing future periods if the same definition is retained.
Engagement is not one number. It is a field of signals.
The interactive model below visualizes the relationship between document views, short attention windows, repeat viewing and access controls. It is an editorial data sculpture, not a literal reconstruction of individual customer sessions.
The document decision field
Drag to rotate. Bright nodes represent returning attention; muted nodes represent first-session activity. The center represents the document or Microsite.
The reason to think in fields rather than funnels is that document engagement does not always move linearly. A recipient can open, leave, return, send the link internally, revisit one page, accept an NDA, download an allowed file, or move from a single document into a broader Microsite. Different verticals create different paths. A fundraising process may generate repeated deck and data-room visits. A legal document may generate fewer but more controlled sessions. A marketing proposal may be forwarded inside a buying committee.
No platform-wide DEI score is published in this edition because the required normalized event inputs are not yet available as validated custom events in the current PostHog implementation. The formula is included as a transparent proposal for future reporting, not as a disguised factual metric.
Why formulas are useful only when definitions stay stable
A formula can make a report look scientific while hiding arbitrary assumptions. That is exactly what this report is designed to avoid. Any future SendNow index should publish its inputs, weights, exclusions and time window. If the definition changes, the historical series should either be recalculated or clearly marked as non-comparable. The value of an index is consistency, not complexity.
| Index | Formula | Example output | Status |
|---|---|---|---|
| Attention Density Index | 150 sec ÷ 8 pages | 18.75 sec/page | Derived |
| Repeat-View Lift | Current ÷ baseline | 1.5× / +50% | Measured change |
| Decision Density Score | Critical pages ÷ total pages × 100 | 75/100 | Modeled |
| Workflow Concentration | Top workflow shares ÷ published shares | ≈52% | Modeled |
| Security Friction Index | Weighted access-control shares | ≤8.0 | Modeled |
| Engagement Readiness Score | Weighted composite model | 72/100 | Modeled |
One behavior layer, different business decisions.
The same engagement primitives—open, depth, duration, repeat, action and access—mean different things depending on who is sharing the document and why.
Startup founders: optimize the first session for clarity, the second for proof
Founders make up approximately 55% of the SendNow user base, making fundraising a natural anchor for document-engagement research. The 2:30 average viewing duration and eight-page average pitch deck suggest that founders should optimize for fast comprehension. The repeat-view increase then creates a second opportunity: make the deck useful when an investor returns to validate a claim, revisit traction, review the team or compare the opportunity against another company.
For fundraising workflows, the document should also evolve with the process. A pitch deck is not a data room. The first link should help generate enough confidence for the next conversation. Once diligence begins, supporting financials, contracts, cap table material and other evidence should move into a more organized controlled environment such as a Microsite or lightweight virtual data room.
Venture capital: engagement can help prioritize, not replace judgment
VC teams may use secure sharing for investment memos, LP materials, portfolio updates and deal documentation. The most important principle is to avoid over-automating interpretation. If a stakeholder returns to a memo three times, that is useful context. It is not a substitute for the investment process. Analytics can reduce uncertainty about whether material is being accessed, while access controls can make time-bound or confidential sharing easier to manage.
Real estate: multi-document decisions reward organized recipient experiences
Real-estate deals often involve presentations, financial documents, property information, offers, supporting reports and legal material. Once the recipient needs several related files, the unit of experience becomes the deal package rather than the individual document. That is where branded Microsites, folders and access controls can reduce fragmentation.
Marketing and sales: attention data should improve follow-up
For proposals, case studies, pitch materials and media kits, the operational question is usually what to do next. A proposal opened once for thirty seconds may deserve a different follow-up from one revisited several times. The right response is not to tell the prospect “we saw you on page seven.” The right response is to use the signal internally to prioritize timing, prepare better questions and send more relevant supporting information.
Legal and production: control may matter more than maximum engagement
Legal, production and other sensitive workflows often have a different success definition. The goal may be to confirm controlled access, maintain an audit trail, discourage unauthorized distribution and give recipients a clean way to review material. A shorter viewing duration is not automatically negative if the recipient only needed a specific clause, page or creative asset.
Medical and regulated workflows: analytics come after appropriateness
Medical and healthcare organizations may handle regulated or highly sensitive information. The existence of access controls does not automatically make every platform configuration appropriate for every type of medical data. Organizations should first determine their legal, contractual and compliance requirements, then decide whether and how document analytics can be used. Public SendNow research should never infer or expose sensitive medical information from customer content.
Measured, derived and modeled are intentionally separated.
The credibility of a research page comes from making the boundary between observation and interpretation obvious.
share.sendnow.live. PostHog currently contains system and autocapture events rather than a full custom SendNow event taxonomy, so feature usage is reconstructed from routes and interface controls.What future SendNow research should add
The next level of research should come from a clean custom event taxonomy inside the SendNow product. Useful events include document opened, page viewed, document completed, return visit, link clicked, download completed, NDA accepted, email verified, Microsite opened, Microsite file opened and link created. Those events should include stable de-identified identifiers and safe metadata such as document length band, file format, device type and broad use-case classification.
Once those events are validated, SendNow can publish far stronger benchmark reports: median completion by length, repeat-view rate by document type, average time to first open, document engagement by device, the relationship between return visits and CTA interaction, security-control adoption by broad workflow, and pitch-deck attention by page position. Every cut should use minimum cohort thresholds so narrow segments do not create re-identification risk.
10M+ views, 10K+ teams, 55% founders, 2:30 duration, 1.5× repeat lift, 8 pages, PDF/PPTX profile.
Nine creator feature shares plus three recipient access/security interaction shares.
Transparent formulas added to help readers interpret the measured signals without hiding assumptions.
Document engagement, answered.
How many document views has SendNow processed?
SendNow reports more than 10 million document views over approximately the last 18 months. The figure is presented as an aggregate platform-scale metric, not as a count of unique people.
What is the average viewing duration?
The average viewing duration supplied for this report is approximately 2 minutes 30 seconds. Duration should be interpreted with document length, repeat behavior and page-level activity rather than as a standalone quality score.
How long is the average pitch deck?
The average pitch deck in the supplied SendNow research profile is approximately eight pages. That figure supports an editorial recommendation for concise, decision-oriented storytelling but does not mean every effective deck should contain exactly eight pages.
What does a 1.5× increase in repeat views mean?
It means the current repeat-view level is approximately one and a half times the earlier baseline used by SendNow. Mathematically, that is a 50% relative lift from the normalized baseline. The absolute repeat-view percentage is not published in this edition.
What are SendNow's most-used creator features?
In the six-month PostHog interaction sample on share.sendnow.live, upload/file selection and link creation/editing each appeared at approximately 15% of creator-side distinct identities, analytics at approximately 9%, Microsites and branding at approximately 8% each, integrations at approximately 7%, security settings at approximately 6%, notifications at approximately 4%, and folder management at approximately 3%. These shares can overlap.
How common are NDA and access gates?
Recipient-side PostHog signals show approximately 15% of distinct recipient identities interacting with an access or unlock flow, approximately 3% with an NDA/agreement flow, and less than 1% with an additional verification step during the measured six-month window. These are not percentages of all 10M+ document views.
Can repeat views prove investor or buyer intent?
No. Repeat viewing can be a useful prioritization signal, but it cannot explain why someone returned or guarantee a future investment, purchase, signature or other outcome.
Why does the report include modeled formulas?
The formulas show how SendNow could build transparent, reproducible research indices without hiding assumptions. Every modeled formula is labeled as modeled, and no invented output is presented as a measured platform fact.
Use the data with attribution.
Journalists, analysts, founders, researchers and publishers may cite the measured findings from this report with attribution to SendNow Research and a link to the canonical report page. When quoting a derived or modeled index, retain the label so readers can distinguish it from measured platform data.
SendNow Research. “State of Document Engagement 2026.” SendNow, September 5, 2026. https://sendnow.live/reports/state-of-document-engagement-2026
Quote-ready measured findings
“SendNow recorded more than 10 million document views over approximately 18 months.”
“Average document viewing duration on SendNow is approximately two minutes and thirty seconds.”
“Repeat document viewing has increased approximately 1.5× from SendNow's earlier baseline.”
“The average pitch deck in SendNow's research profile is approximately eight pages.”
Share documents with context.
Control access, understand engagement and move multi-file decisions into a clearer recipient experience.