What Is a Document Heatmap? A Plain-English Guide

What Is a Document Heatmap? A Plain-English Guide
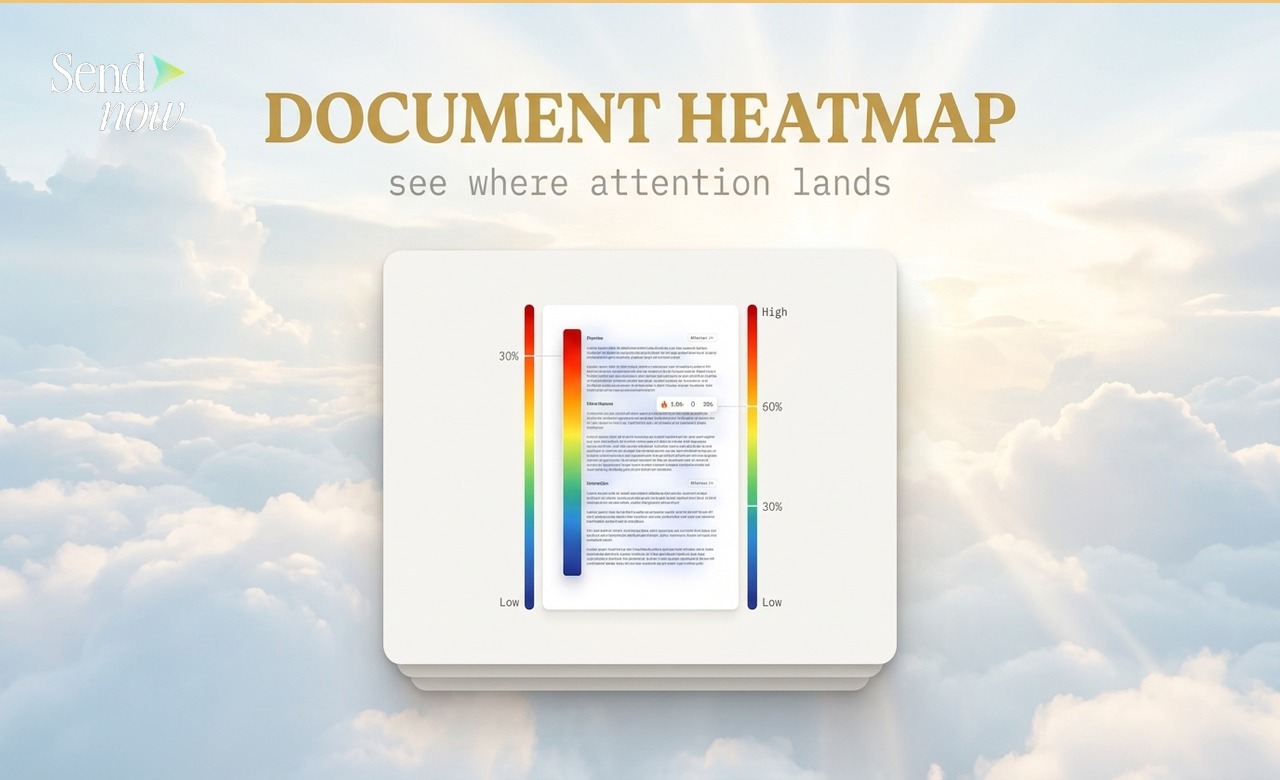
A document heatmap is a visual representation of how much time viewers spend on each page of a shared file. Pages that receive the most attention appear in warm colours such as red and amber; pages that are skimmed or skipped appear in cooler tones. It tells you, at a glance, where interest is concentrated and where it drops off.
Why Page-Level Attention Data Is Useful
Knowing that someone opened your document is useful. Knowing which three pages they spent the most time on is far more actionable. A finance professional sharing a 40-page pitch deck can use heatmap data to see whether prospects are spending time on the financial model or stopping at the executive summary, which informs both follow-up conversations and future document design.
Document heatmaps are particularly valuable when you share the same document with multiple recipients. Patterns emerge: if every reader spends longer on page 12 than anywhere else, that page contains something worth discussing.
How a Document Heatmap Works
Each time a recipient views a page of your document, the viewing platform records the time spent on that page. After several visits, the accumulated data is presented as a colour-coded chart or overlay:
- Red / deep amber: High attention, longest average time spent
- Mid amber / yellow: Moderate attention
- Cool blue / grey: Lower attention, pages skimmed or skipped
This is analogous to a website heatmap, but applied to the pages of a document rather than the sections of a web page.
What SendNow Shows You
In SendNow, the document heatmap is presented as a per-page bar chart in the analytics panel for each document. Each bar represents one page of the document, and its length corresponds to the average number of seconds viewers spent on that page.
You can view this data for individual visitors or as an aggregate across all viewers of a document. The per-visitor view is useful for sales follow-up; the aggregate view is useful for improving future document design.
Page Attention Bar Chart

The page analytics chart in SendNow shows you seconds per page in a clean horizontal bar format, colour-coded by attention level.
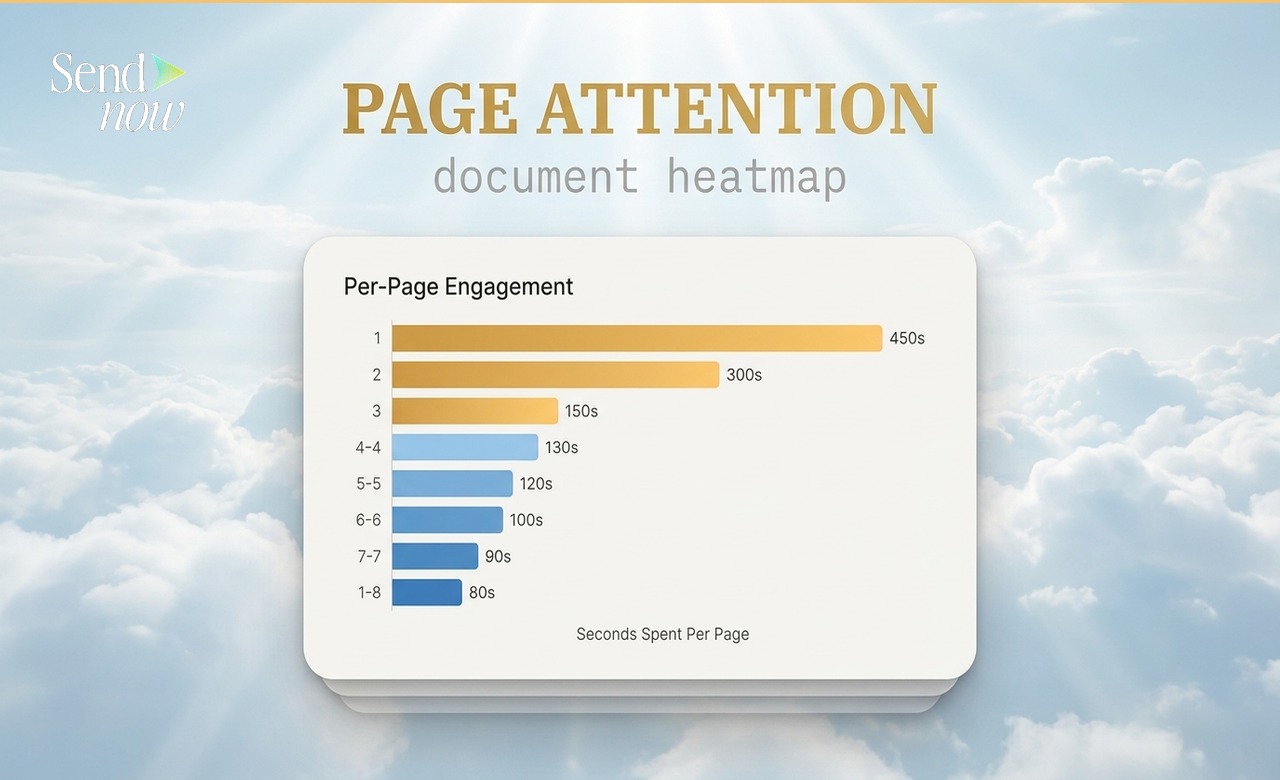
This makes it easy to spot anomalies. A page with near-zero reading time may contain unnecessary content. A page with unusually high time may be confusing or contain content that prompts deeper analysis.
Interpreting Heatmap Data
Page-level attention data is a signal, not a verdict. A page with low reading time might mean the reader found it irrelevant, or it might mean the content was immediately clear. Context matters. A heatmap should be read alongside completion rate and return visit data for the richest picture.
Common findings from document heatmaps:
| Finding | Likely Interpretation |
|---|---|
| High time on pricing / terms page | Prospect is evaluating seriously |
| Drop-off after page 5 | Reader lost interest or received the answer they needed |
| Unusually low time on a technical page | Content may be unclear or the wrong audience |
| Multiple return visits to page 2 | Key information may need to be moved earlier |
| Consistent high attention on appendix | Appendix content may deserve promotion to the main body |
Document Heatmaps in the Context of Full Analytics
A heatmap is one layer of a broader analytics picture. For a complete view of document performance, you want to combine page attention data with:
- Completion rate (did they reach the final page?)
- Return visits (did they come back?)
- Time of open (when did they read it?)
- Geographic location (where were they when they read it?)
The Complete Guide to PDF Tracking covers all of these dimensions in detail. For information on completion rates specifically, see the Document Completion Rate Guide.
How to See Which Pages Were Actually Read
If you need page-level data without the heatmap visualisation, the per-page time chart in SendNow gives you the same underlying information in numerical form. You can see exactly how many seconds were spent on every page, per visitor or in aggregate.
For a guide focused specifically on page-level reading data, see How to See Which Pages of a PDF Were Read.

GDPR and Document Analytics
Document analytics, including heatmap data, involves processing behavioural data from named or identifiable recipients. Under EU GDPR, this data is personal data when it can be linked to an individual. SendNow handles analytics data in line with GDPR requirements, and your privacy policy should disclose that you use document tracking when sharing files with EU-based recipients.
Frequently Asked Questions
Q1: Do I need to do anything to enable document heatmaps in SendNow? No. Page-level analytics are captured automatically for every document link. The heatmap view is available in your document's analytics panel as soon as data starts coming in.
Q2: Does the heatmap show individual viewers or an average? Both. You can view aggregate attention data across all viewers, or drill into a specific visitor's page-by-page engagement.
Q3: How many pages does the heatmap support? SendNow records page-level data for every page of your document, regardless of length.
Q4: Can I compare heatmaps across different recipients? Yes. The per-visitor breakdown allows you to compare how different recipients engaged with the same document.
Q5: What counts as "time on page"? Time on page is the duration between when a page became visible to the viewer and when they moved to the next page. Idle browser tabs may affect accuracy for sessions that were left open.
Q6: Is heatmap data available for older documents? Yes. Heatmap data is stored for all documents and visitors in your SendNow account, including historic activity.
Q7: Can I export heatmap data? SendNow analytics data is available within the dashboard. Contact the team if you require data exports for reporting purposes.
Q8: Does a document heatmap work for presentations as well as PDFs? Document heatmaps in SendNow work for any file format that renders as a page-based document, including PDFs and presentations uploaded in compatible formats.
For a broader understanding of document engagement metrics, read the Complete Guide to PDF Tracking.
SendNow offers a free trial — no credit card required. Start at sendnow.live
About the Author: Rifana Hameem
Rifana is the founder of SendNow. She leads the team in building secure, compliant, and analytics-rich document sharing tools for finance and professional teams worldwide.
Connect on LinkedIn