
Understand your analytics overview
The Analytics page rolls up every link and document you have access to into one dashboard — total views, unique visitors, completion, and where the traffic is coming from.
Open Analytics
Click Analytics in the sidebar. Unlike a single link's own analytics, this page is account-wide — it pulls in every link across every document you or your team own.
Read the top stat row
Seven numbers, left to right: Total Links you've created, Total Views across all of them, Unique visitors (counted by email if they gave one, otherwise by IP address), Bounce (the share of views that left before reading 10% of the document), Completion (the average % actually read), then the single Top Country and Top Source by view count.

Check Devices and Traffic Sources
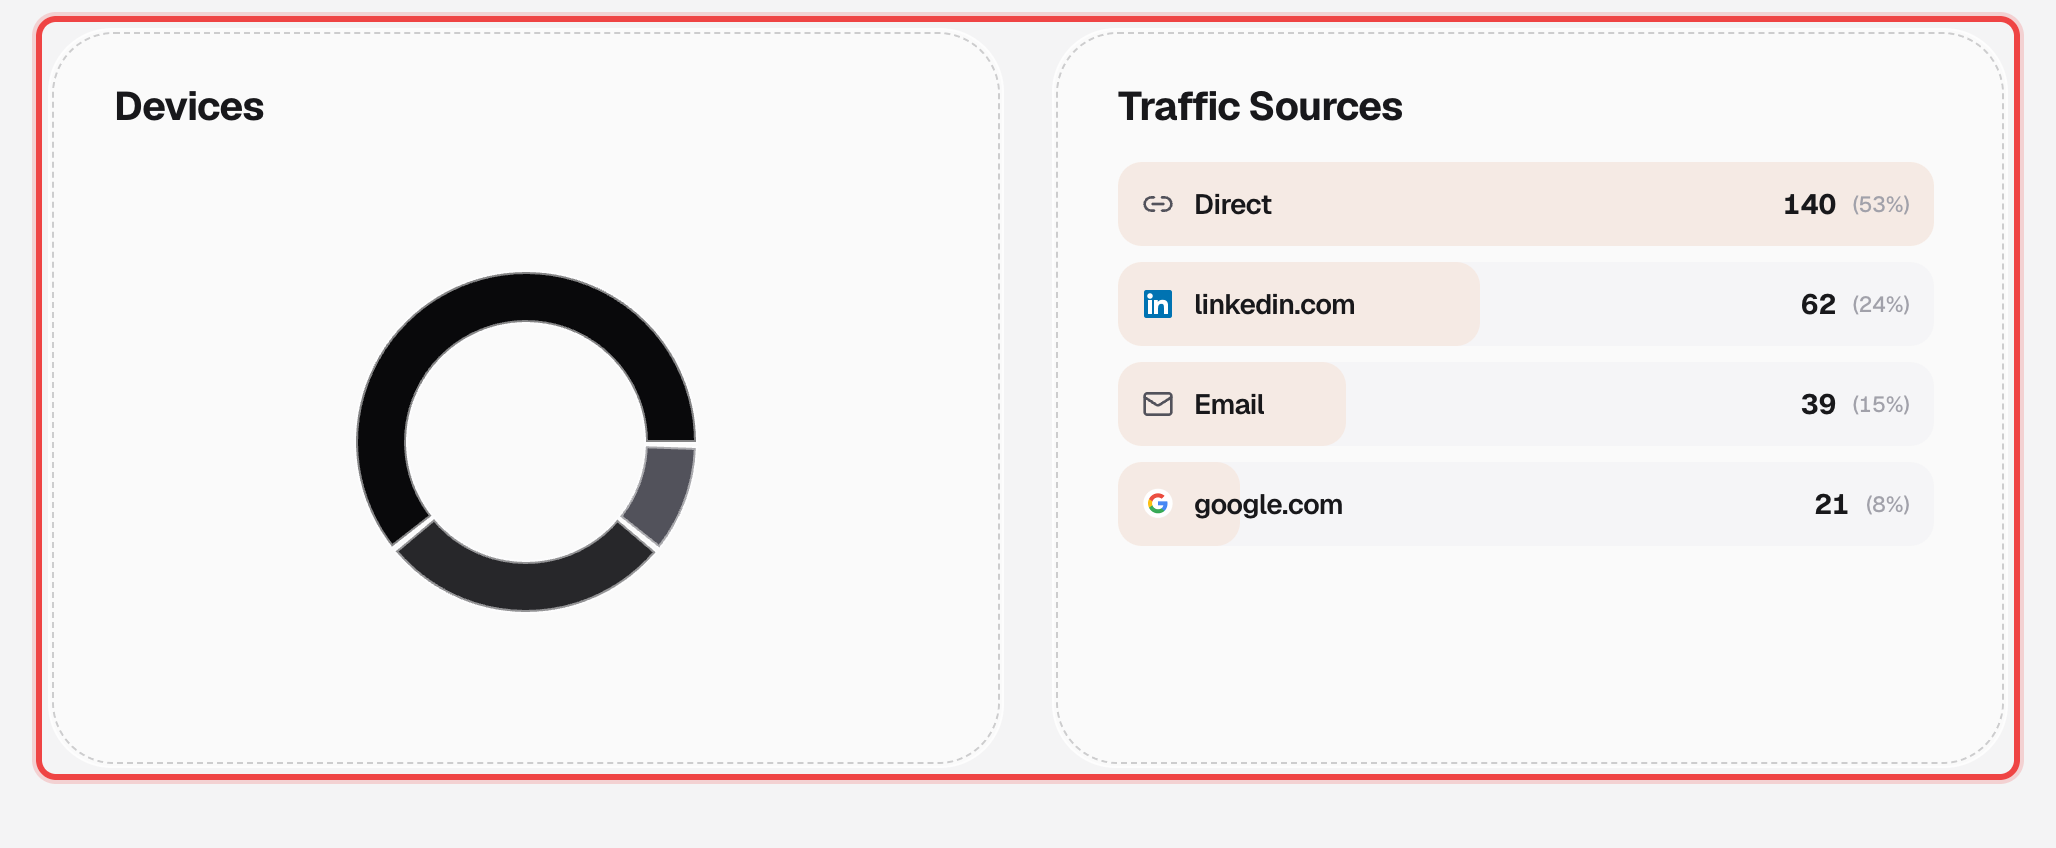
The Devices card breaks views down by desktop, mobile, and tablet. Traffic Sources ranks where visits came from — direct, email, or a referring site, each shown with its real favicon.
Scroll to Top Locations
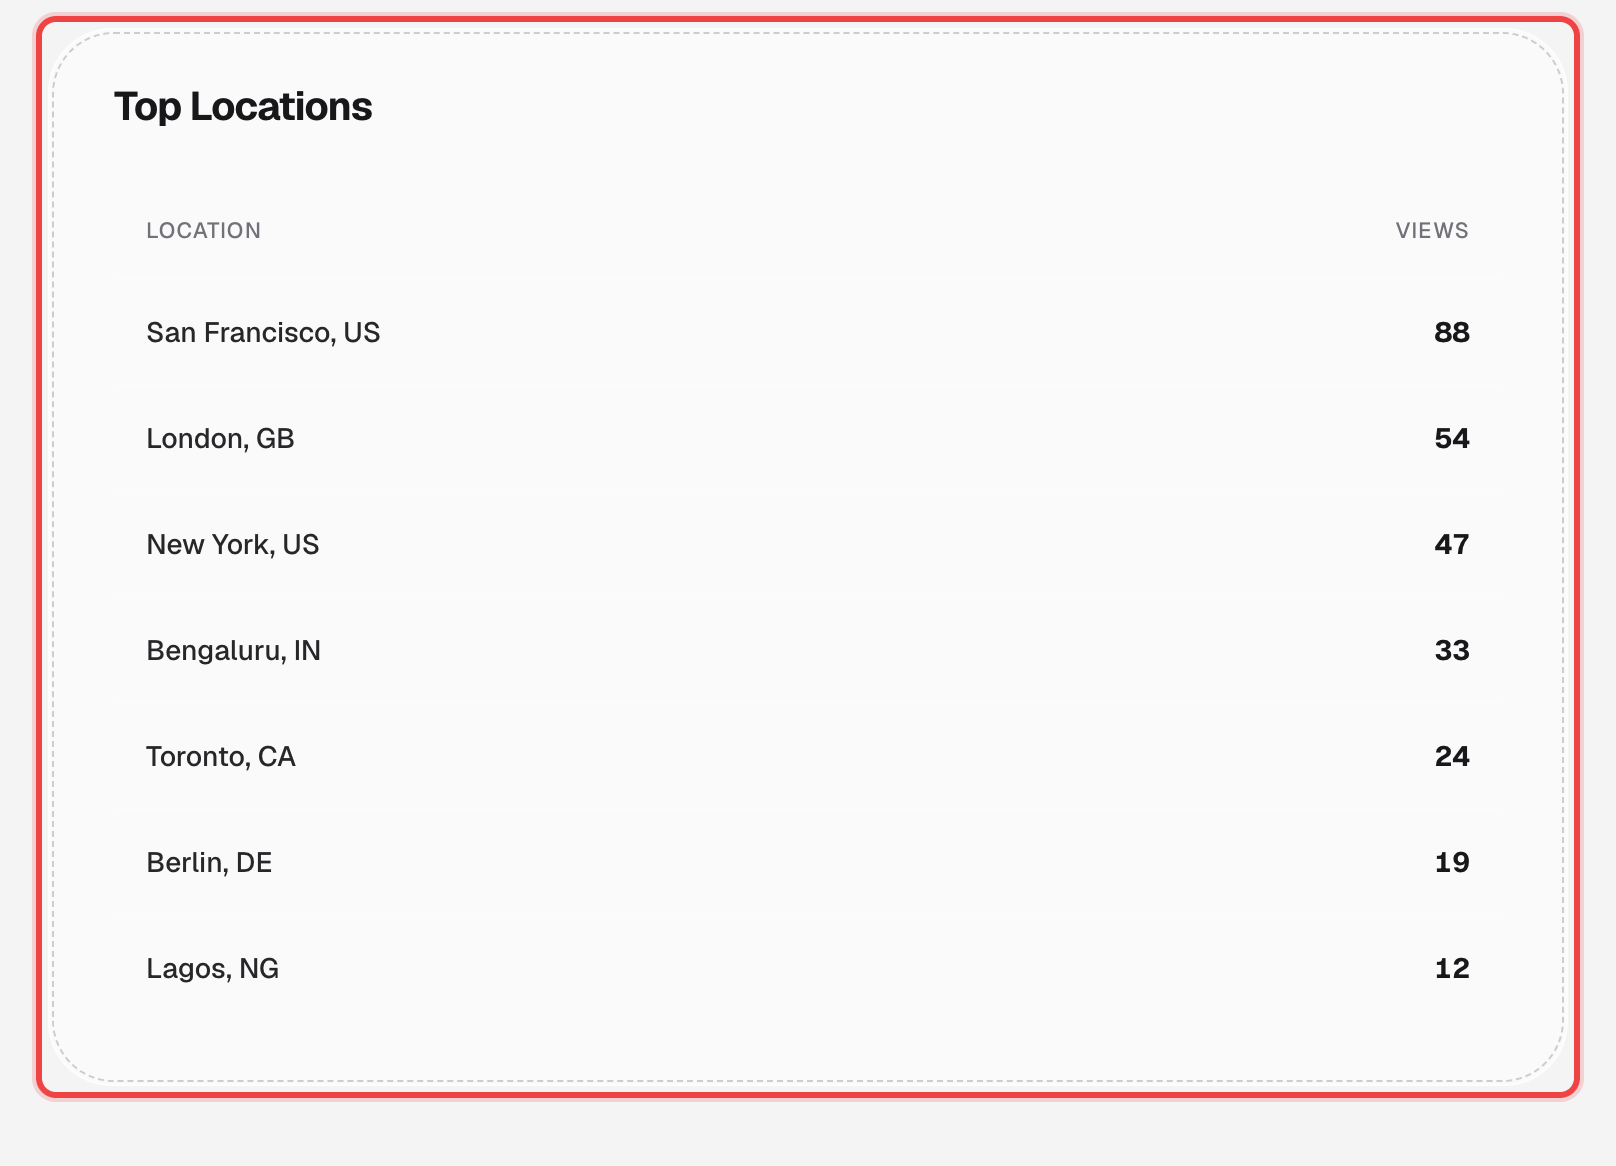
A ranked table of the cities and countries your documents have been viewed from, most-viewed first.
Good to know
- These numbers are account-wide. For one link's own numbers, open that link's Analytics page instead — see page-by-page engagement.
- A viewer only counts as "Unique" once per email address (or per IP address, if no email was captured).
- A view counts toward Bounce once its completion is below 10% — someone who opens a link and leaves immediately still counts in Total Views, just not toward Completion.