
See page-by-page engagement on a link
Every link has its own Analytics page. Open it to see exactly how long visitors spent on each page, so you know which page people actually read and where they stopped.
Open a link's Analytics
From your document's Links list, click the dark View analytics button on that link's row — the bar-chart icon, separate from editing the link.
Read the link's stat row
Total Views and Unique are scoped to this one link. Avg. Time and Completion are averages across all its visits. Downloads counts clicks on the download button, and NDA Signed only appears when the link requires one.

Read the Per-Page Engagement chart
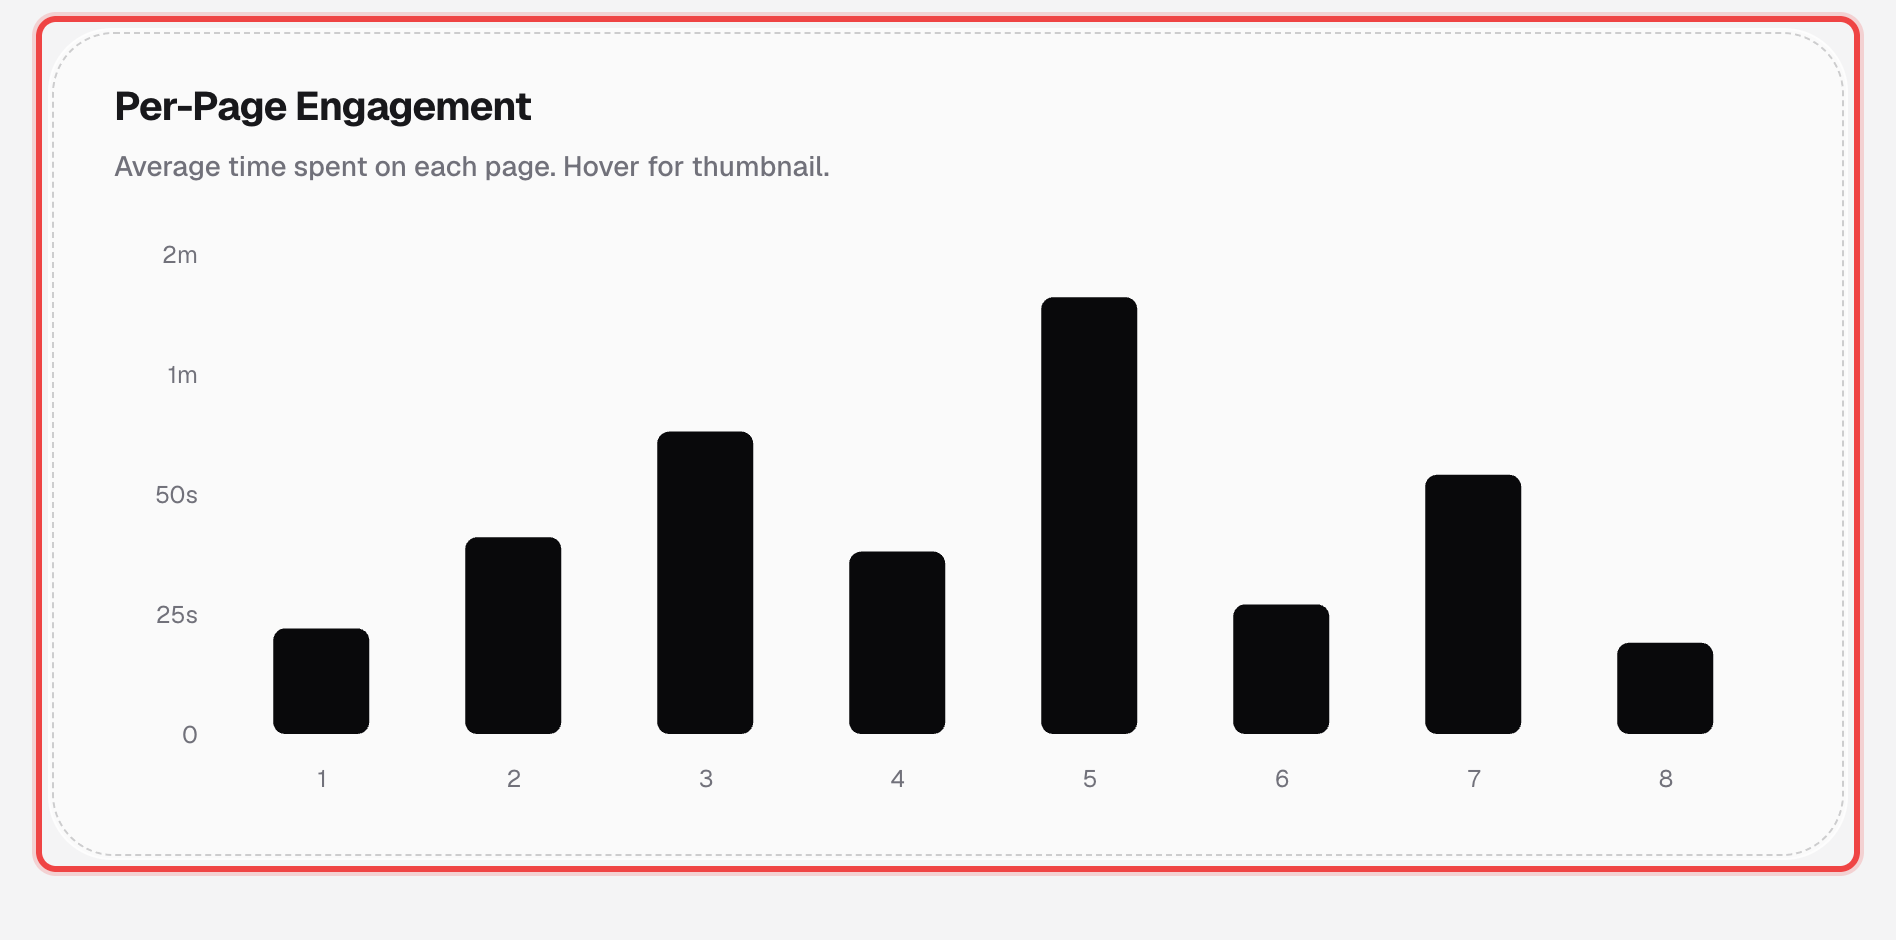
Each bar is one page of the document, showing the average time visitors spent on it before moving on. A tall bar next to short ones either side is a page people paused on — hover any bar for its thumbnail.
Switch file versions if you've replaced the file
If you've uploaded a new version of the file, a File dropdown appears above the stat row. Each version's visits are tracked separately — page 6 of v1 isn't the same page as page 6 of v2.
Good to know
- For a video file, this chart is replaced by Video Engagement — watch time, play/pause/seek counts, and a quartile-completion chart instead of per-page bars.
- On a phone, the chart becomes a tappable list of pages instead of upright bars — they don't survive a narrow screen once a document runs past a handful of pages.
- Clicking a row in Traffic Sources, Devices, or Locations further down the same page narrows the whole page — stat row, chart, and visitor list — to just those visits. See location & device breakdown.